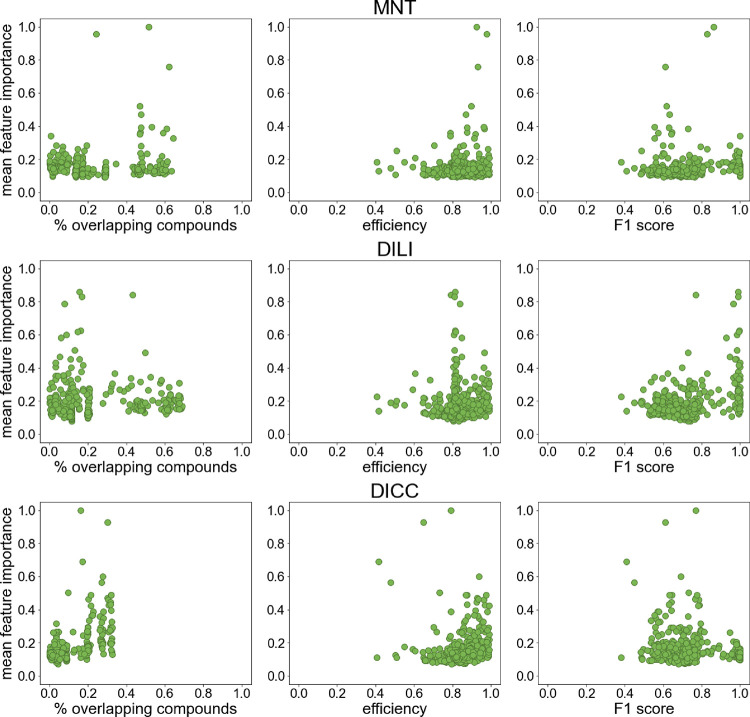
Figure 8.
Mean feature importance reported by the RF model for the bioactivity descriptors in relationship with the percentage of overlapping compounds (of the in vivo data set), the efficiency and F1 score of the models for each biological assay. For each of the 373 biological assays, the highest mean feature importance of the two p-values used as descriptors (for the active and inactive classes of each assay) was taken. The feature importance values were normalized with a min-max normalization (from 0.01 to 1; see Materials and Methods section) for easier comparison.

