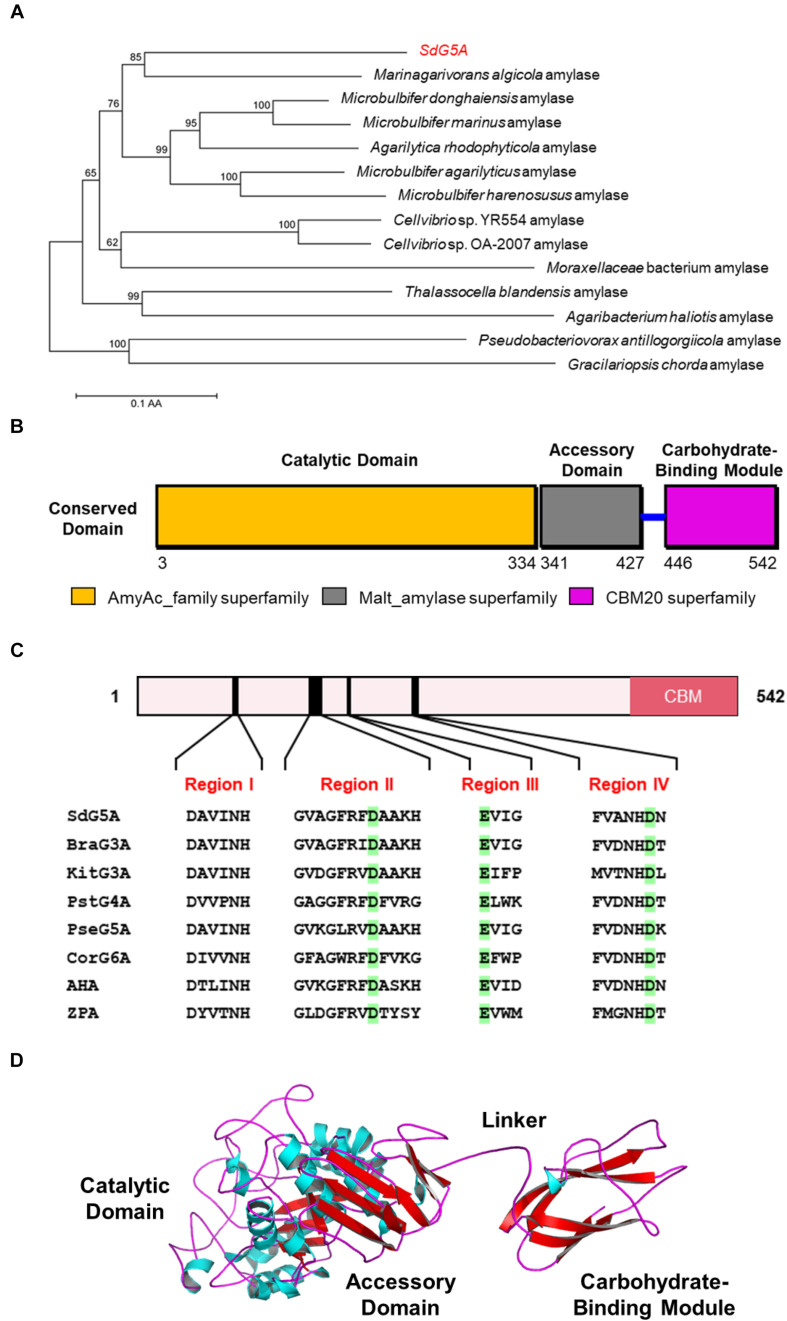
FIGURE 4.
Sequence and three-dimensional structure analysis of SdG5A. (A) Phylogenetic tree of the amino acid sequences of SdG5A. The tree was constructed using the neighbor-joining algorithm of the MEGA program (version 5.0). Bootstrap values (n = 1,000 replicates) are reported as percentages. The scale bar represents the number of changes per amino acid position. (B) Analysis of the conserved domains identified by Conserved Domain Database (Marchler-Bauer et al., 2017). (C) Conserved regions I–IV of α-amylases. Amino acid residues corresponding to catalysis are highlighted in green. (D) Template-based predicted structure model of SdG5A.

