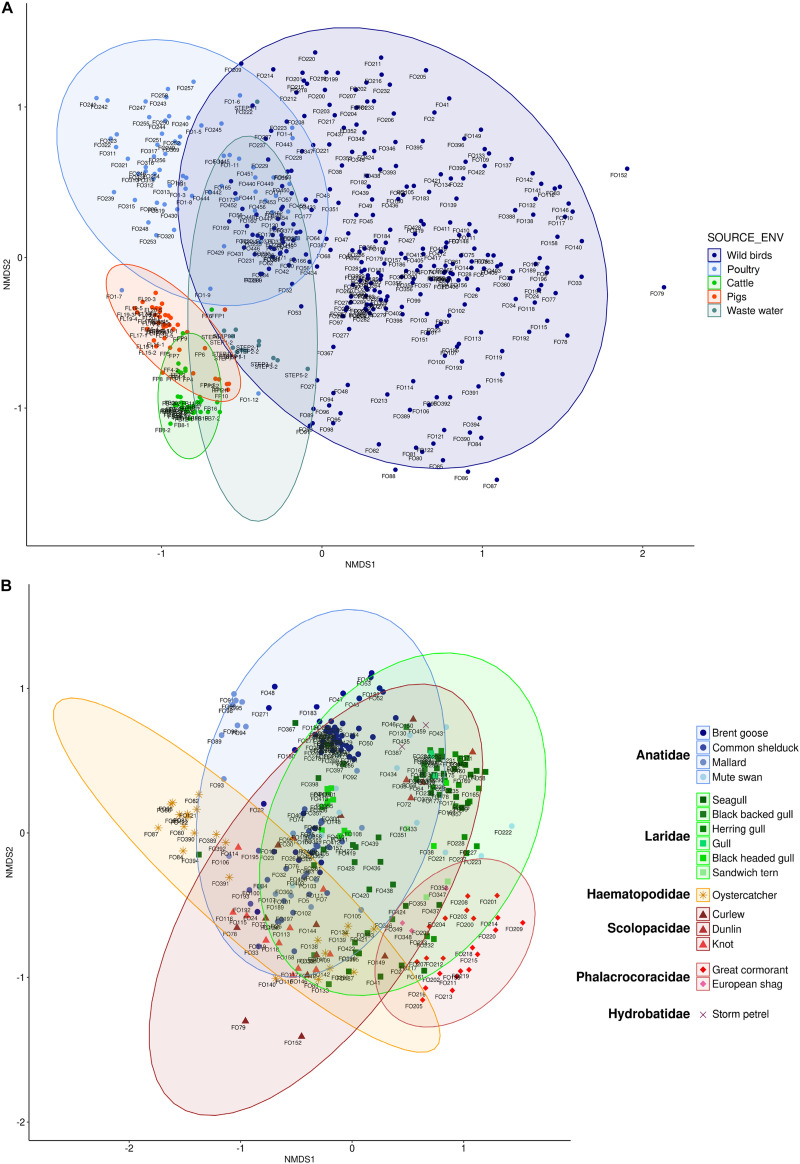
FIGURE 5.
Non-metric multidimensional scaling (NMDS) plots based on Bray–Curtis (A, stress = 0.177; B, stress = 0.179) distance metrics in relation to the whole dataset (A) or the wild waterbird groups (B). Colors represent host classes. Ellipses represent 95% confidence intervals of centroids of each point.

