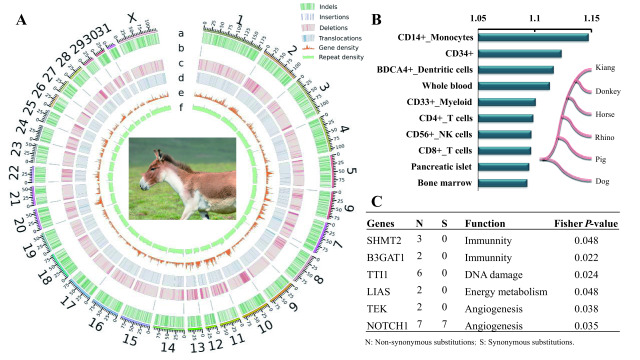
Figure 1.
Genome evolution in kiangs
A: Distribution of structural variants compared with horse genome. Tracks (outside to inside) show chromosomes, a: indel density, b: insertion density, c: deletion density, d: translocation density, e: gene density, f: repeat density. Density of indels, insertions, deletions, and translocations, was calculated from a 1 Mb non-overlapping sliding window, and 500 kb non-overlapping sliding window for gene density and repeat density of the horse. B: Expression analysis of REGs based on human expression data. Analysis was performed as described previously (Li et al., 2013). Human gene expression data (Human U133A Gene Atlas) in 84 tissues or cells were downloaded from BioGPS (Wu et al., 2016) (http://biogps.org/#goto=welcome). Relative expression level of REGs in each tissue was calculated by mean expression value of REGs in tissue divided by average whole-genome expression value. Only top 10 tissues/cell lines are presented. Species tree of six mammals was used to detect positively selected genes in kiang lineage (as foreground lineage) by branch site model in PAML. C: McDonald-Kreitman (MK) test identified several genes related to immunity, DNA damage, energy metabolism, and angiogenesis under positive selection in kiang lineage.

