Figure 1.
Single-cell RNA sequencing reveals atlas of dairy goat testis cells
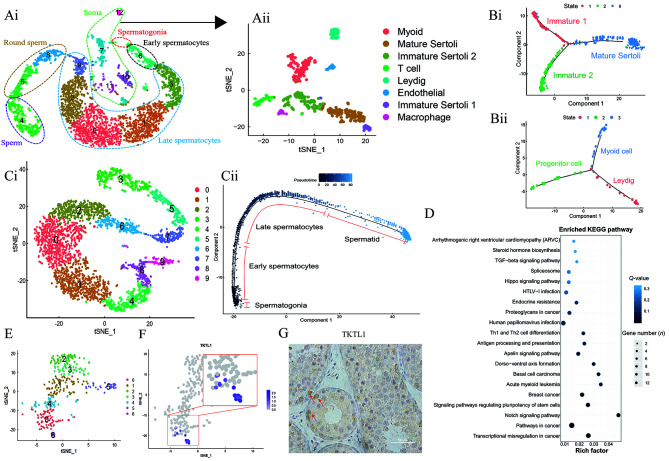
Ai: t-SNE cluster containing 3 890 cells (cells are colored by 13 broad cell types). Aii: t-SNE diagram of somatic cells in testis of dairy goat (cells are colored by eight broad cell types). Bi: Pseudotime trajectory analysis of Sertoli cells. Bii: Pseudotime trajectory analysis of Leydig and Myoid cells. Ci: t-SNE image of testicular germ cells in dairy goats (cells are colored by 10 broad cell types). Cii: Pseudotime trajectory analysis of germ cell clusters. Shades of blue indicate sorting according to pseudotime value. D: KEGG analysis of main differentially expressed genes during spermatogenesis. E: t-SNE diagram of re-clustering of spermatocytes and spermatogonia in dairy goat testes (cells are colored by seven broad cell types). F: Expression distribution of TKTL1 in spermatogonia clusters. G: Immunohistochemical staining for TKTL1 expression in dairy goat. Red arrows indicate spermatogonia. Scale bar: 50 μm.

