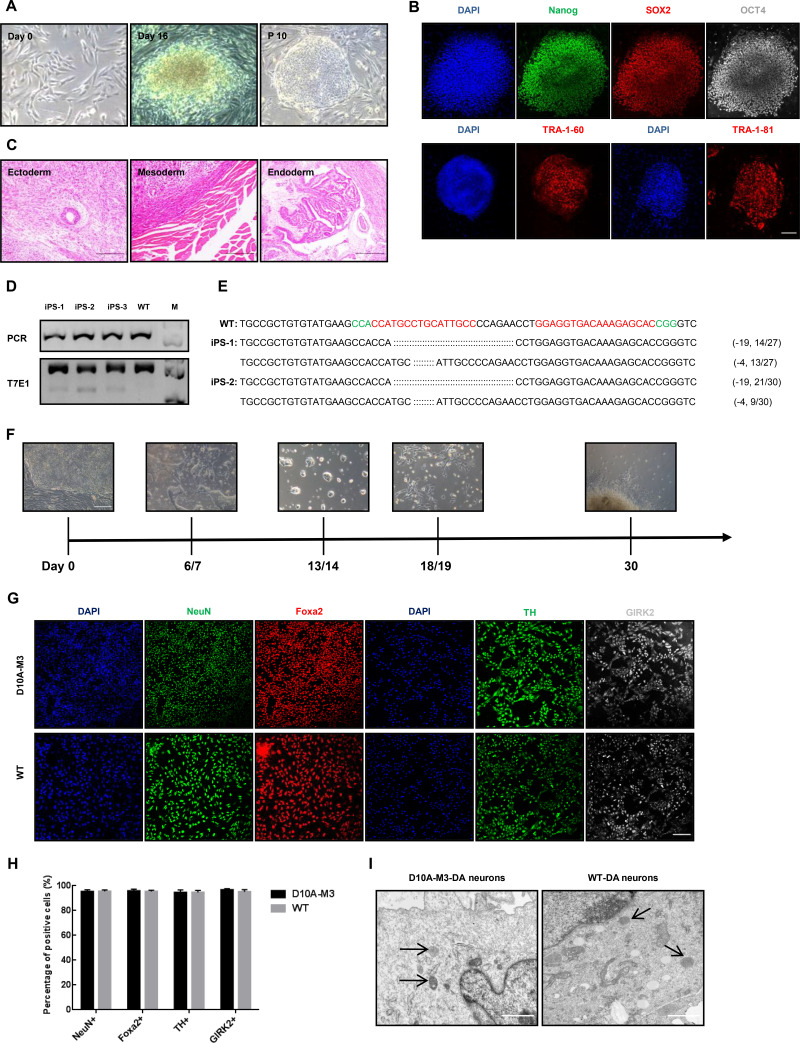
Figure 3.
PINK1 mutant fibroblast-derived DA neurons did not show any specific PD-associated phenotypes
A: Reprogramming of fibroblasts into iPSCs by Sendai virus. Images represent typical cell phenotypes observed on days 0 and 16 after virus transduction and iPSC phenotypes at passage 10. Scale bars: 500 μm. B: Immunofluorescence staining of pluripotency markers OCT4, Nanog, SOX2, and TRA-1-81/60 in iPSCs. Scale bars: 250 μm. C: Teratoma differentiation of iPSCs in immunodeficient mice (NOD/SCID). Left, ectoderm; middle, mesoderm; right, endoderm. Scale bars: 500 μm. D: T7E1 cleavage assay of target sites amplified from three iPSC clones reprogrammed from D10A-M3 fibroblasts. Top panel represents undigested PCR bands, and bottom panel represents digested PCR products. E: Genotypes of iPSC-1 and iPSC-2. Two iPSCs showing different lengths of DNA fragments. F: Induction process of iPSCs to DA neurons. During induction, different differentiation and maturation media need to be replaced. After 30 days, DA neurons can be obtained. Scale bars: 500 μm. G: Representative images showing immunofluorescence staining of D10A-M3 and WT iPSC-derived DA neuron markers NeuN, Foxa2, TH, and GIRK2. Scale bars: 250 μm. H: Relative expression levels in (G) were calculated via ImageJ 1.8.0 software. No significant differences were observed between the proportion of mature DA neurons in D10A-M3 and WT during induction. I: Mitochondrial morphology of D10A-M3 and WT-derived DA neurons under electron microscopy. Compared with WT monkey, D10A-M3 exhibited similar mitochondrial morphology. Arrows, mitochondria of D10A-M3 and WT-derived neurons Scale bars: 1 μm.

