
Figure 2.
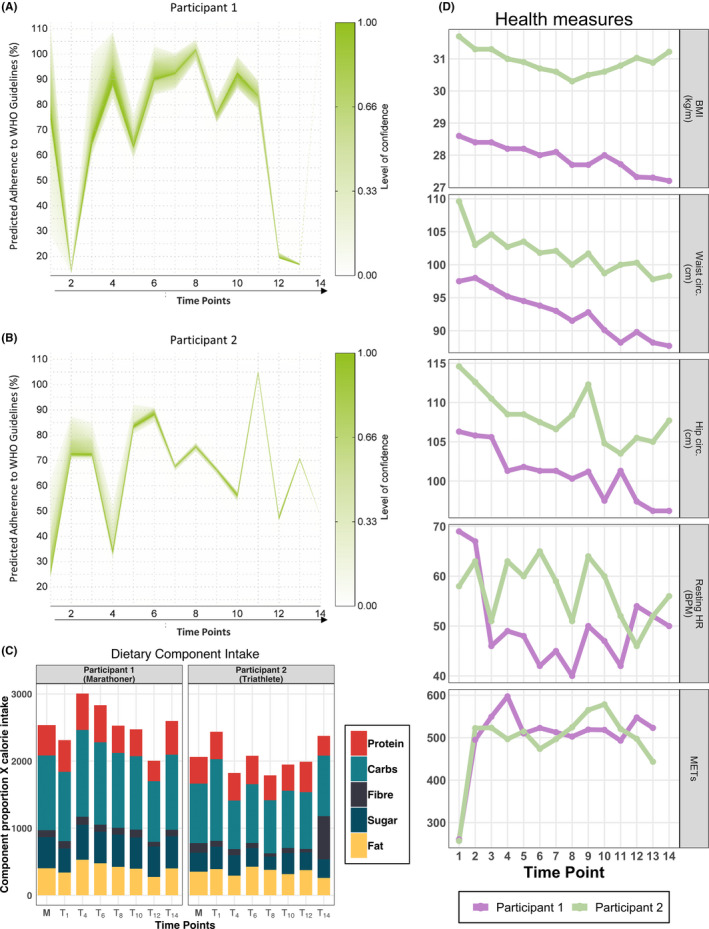
Diet and fitness characteristics. A and B, Objective assessment of adherence to WHO dietary guidelines based on the urine composition using 1H‐NMR urinary profiles from participant 1 (marathoner) (A) and participant 2 (triathlete) (B). The X‐axis represents time points of the study while the Y‐axis indicates the predicted percentage of adherence to WHO dietary guidelines. The level of confidence in the prediction is described by the index to the right. Participant 1 exhibits a more sustained improvement in adherence to WHO dietary recommendations (A). Participant 2 demonstrates more fluctuation in their adherence to WHO dietary recommendations, combined with lower levels of prediction confidence (B). C, Nutritional constituents of participants over the study period. Along the X‐axis are time intervals beginning with the first period (T1, baseline to two weeks), while the Y‐axis describes average macronutrient proportions multiplied by calorie averages. Daily averages of dietary macronutrients recorded over time intervals as grams per day, presented as proportions of time interval total intake, and scaled to average caloric intake per interval. Bar sums indicate average daily caloric intake, with participants’ averages for calories and dietary components indicated (M). D, Participant body composition and fitness measurements. Fitness parameters improved during the observation period. BMI, hip and waist circumference, and resting heart rate (bpm) were shown to have an overall reduction. Physical activity was elevated for both participants throughout the study. BMI, body mass index; bpm, beats per minute; HR, heart rate; METS, metabolic equivalents