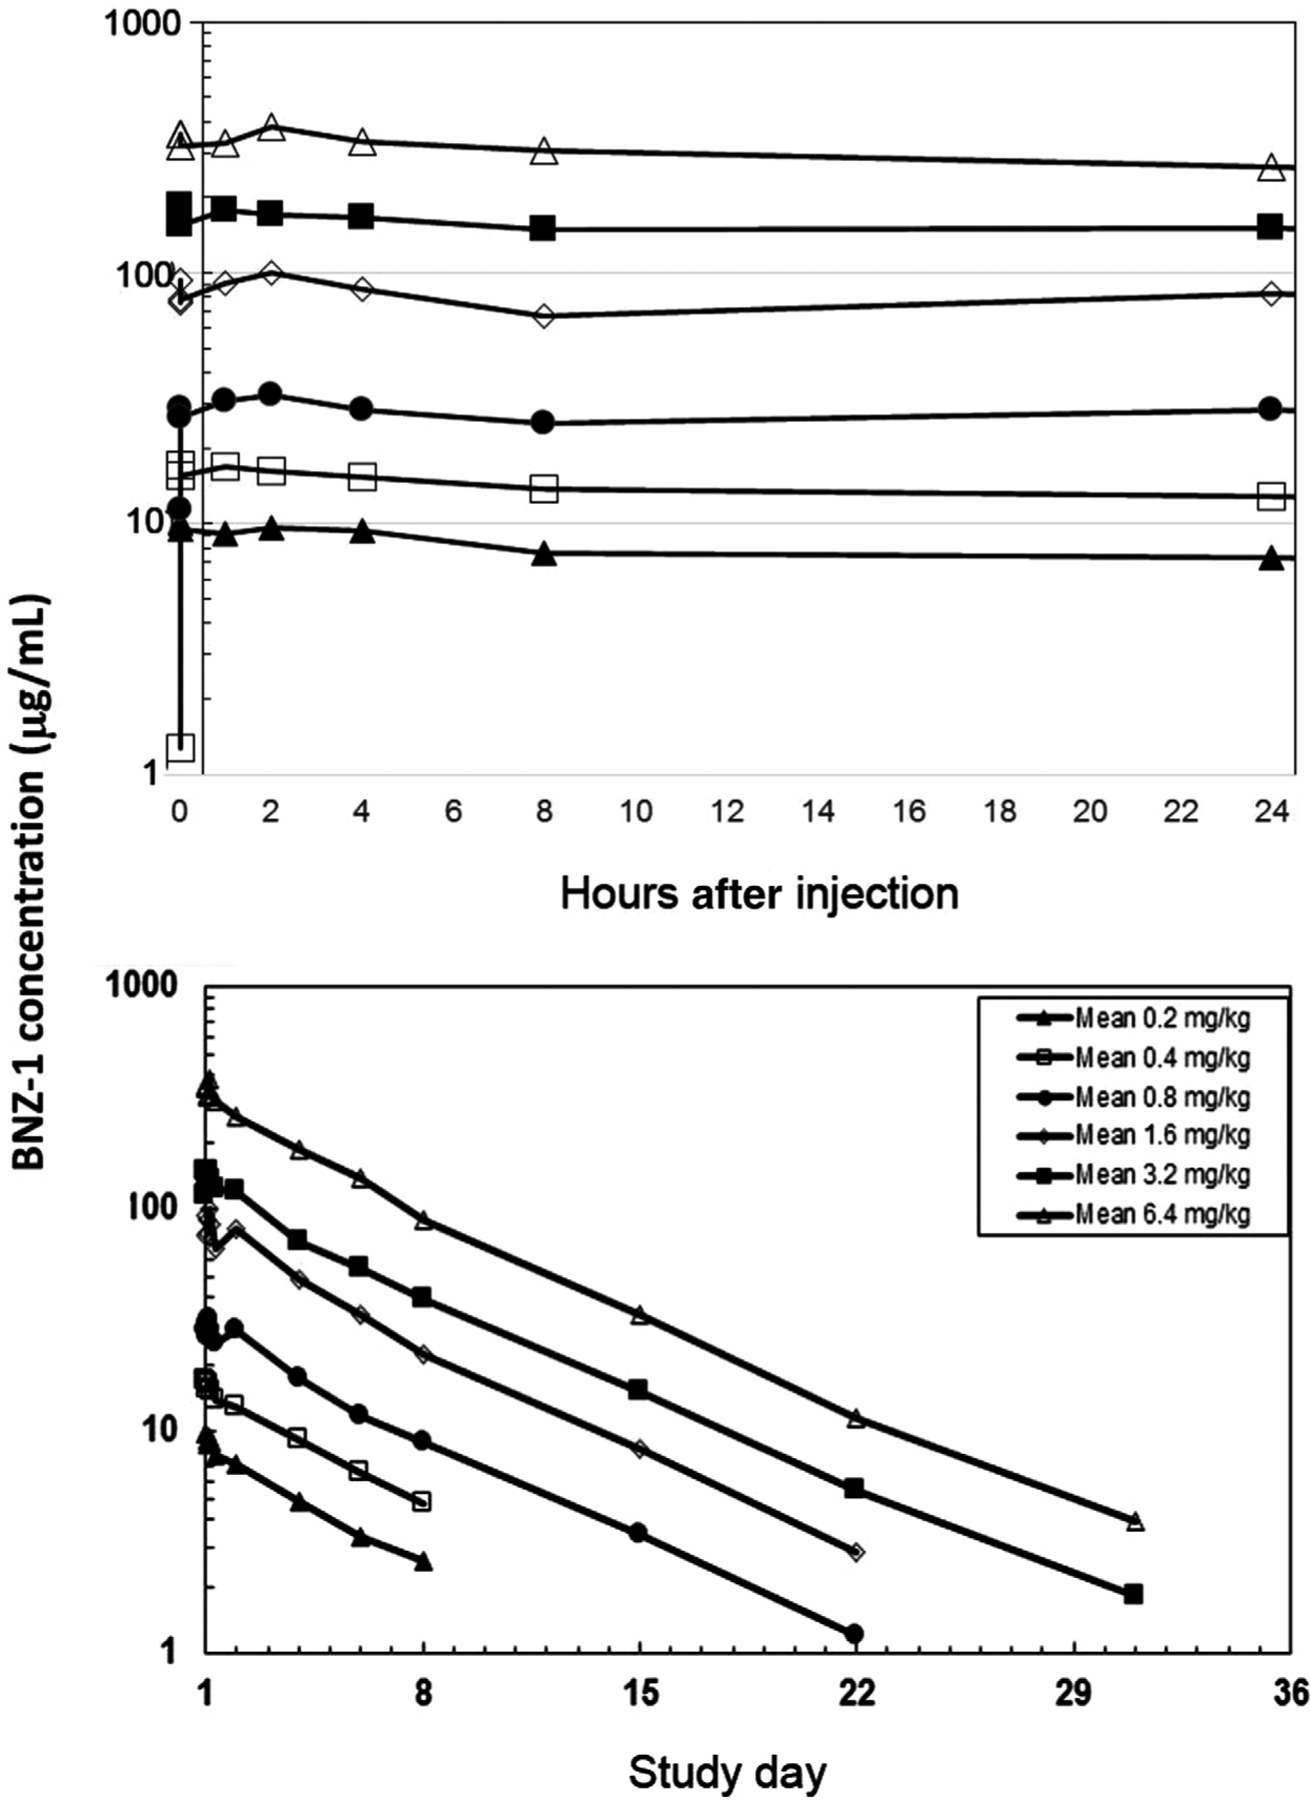
Figure 2.

A single IV dose of BNZ-1 was administered over ≤5 minutes starting at time = 0, day 1. PK samples were collected at 0.08, 0.5, 1, 2, 4, 8, and 24 hours after dosing, and on days 4, 6, 8, 15, 22, and 31. The plot shows the average plasma concentration at each time point (n = 3). The upper figure represents the distribution phase (up to 24 hours), and the lower figure shows the elimination phase (days 2–36). IV, intravenous; PK, pharmacokinetic.
