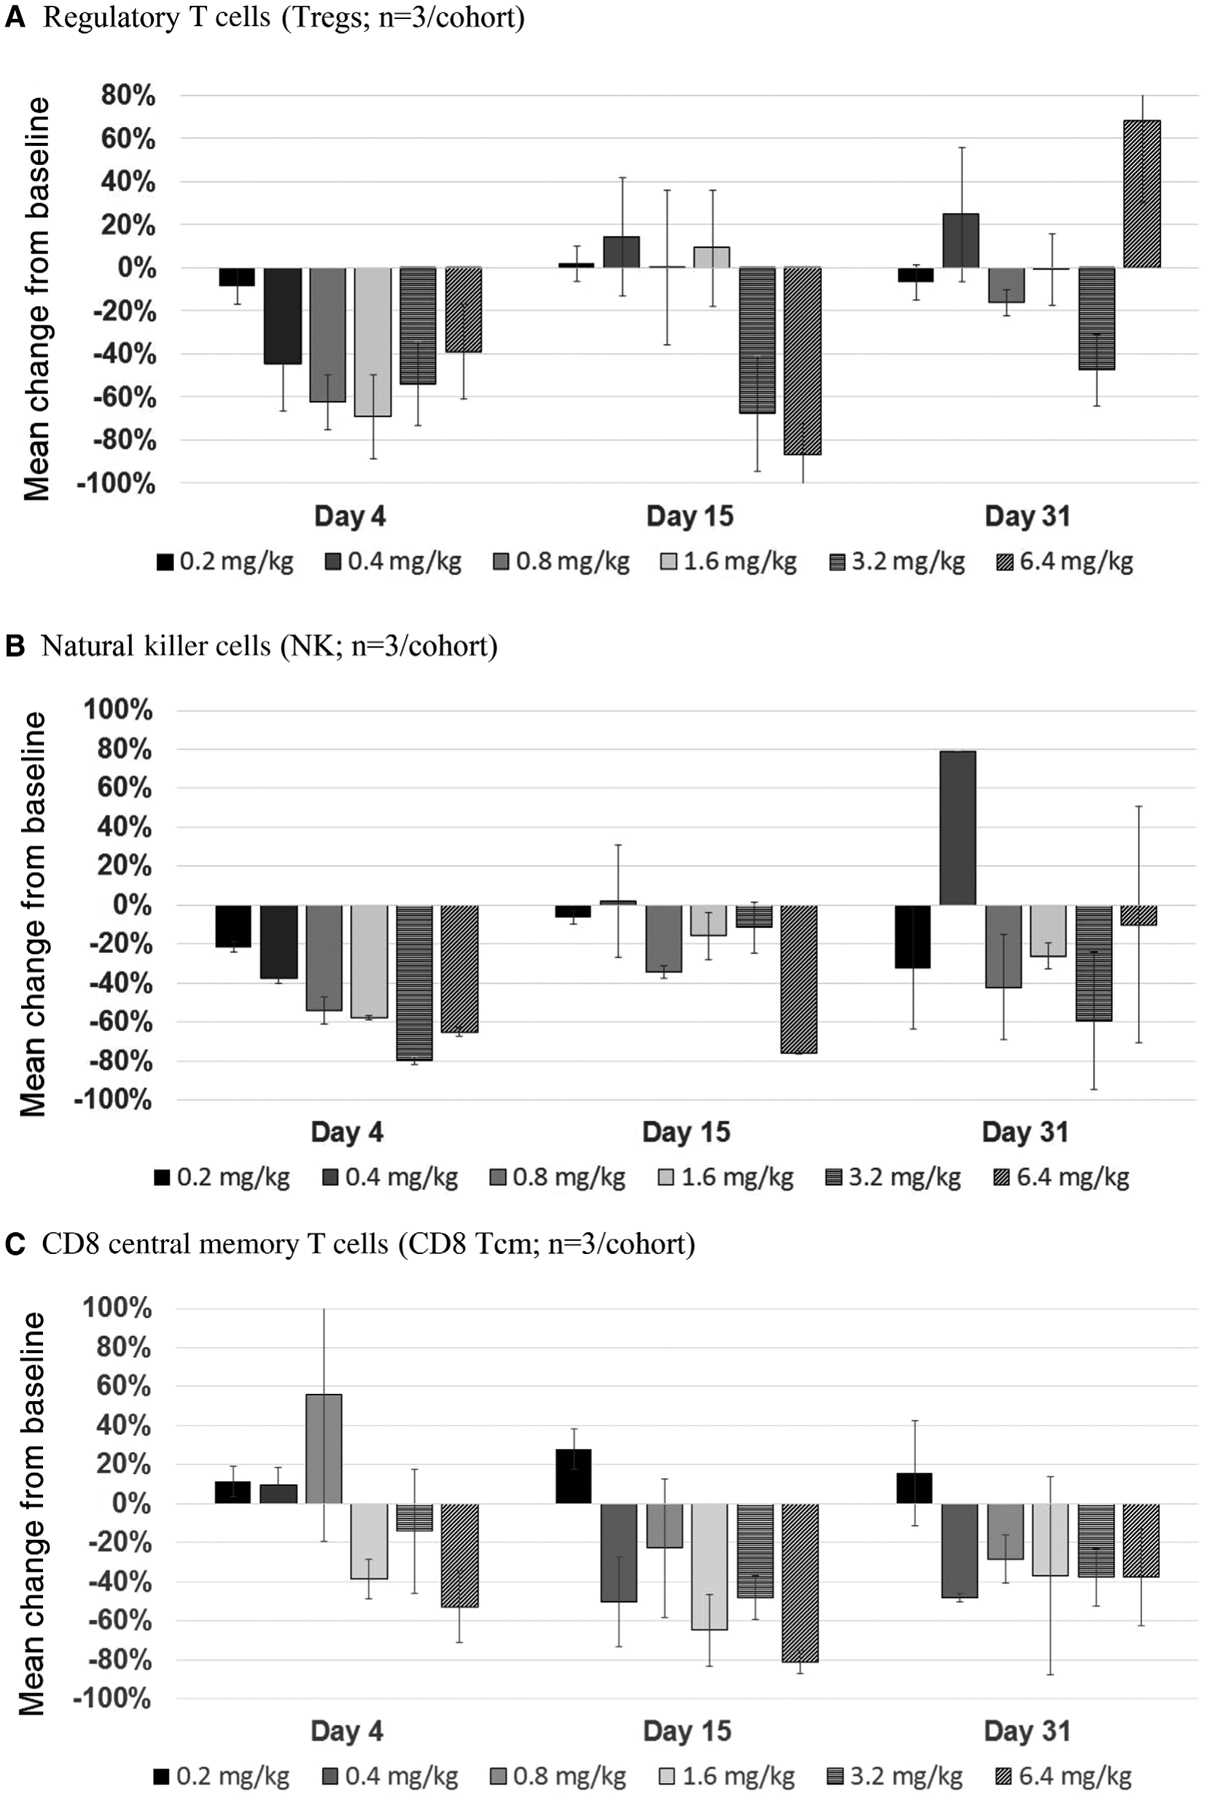
Figure 3.

Whole blood samples for isolation and staining of PBMCs were collected before dosing on day −1 and after dosing on days 4, 15, and 31 and used to measure Tregs (A), NK cells (B), and CD8 central memory T cells (C). Samples were shipped overnight to the lab, stained the next day, and analyzed by FACSAria II polychromatic fluorescence cell analyzer. The graphs show the average percent change from baseline, calculated using the following equation: % Change = (% postdose – % predose) ÷ % predose. Each bar represents n = 2–3, and standard deviation values are shown. PBMCs, peripheral blood mononuclear cells.
