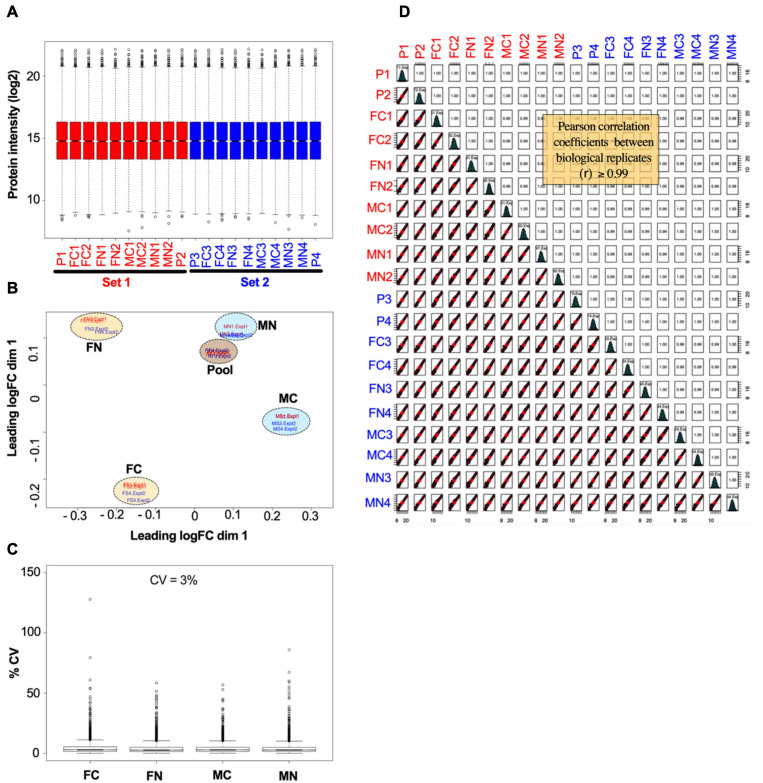
FIGURE 2.
Example of data normalization by sample loading, TMM, and IRS, using data from the VTA after chronic nicotine and withdrawal. (A) Normalized intensity values for each reference pool (P1, P2, P3, P4) and experimental sample in each of the two TMT experimental sets (red and blue) are shown as box plots. (B) Principal component analysis of sample intensity values shows clustering of the samples by experimental groups and reference pooled samples, where each oval encompasses the biological replicates run in each TMT experimental set. (C) The coefficients of variance of each experimental group averaged ∼3% after normalization. (D) Quality control analysis showing, for each biological replicate, scatter plots of normalized quantification values (log2 of TMT intensities) and Pearson correlation coefficients, which ranged from 0.99 to 1.00.

