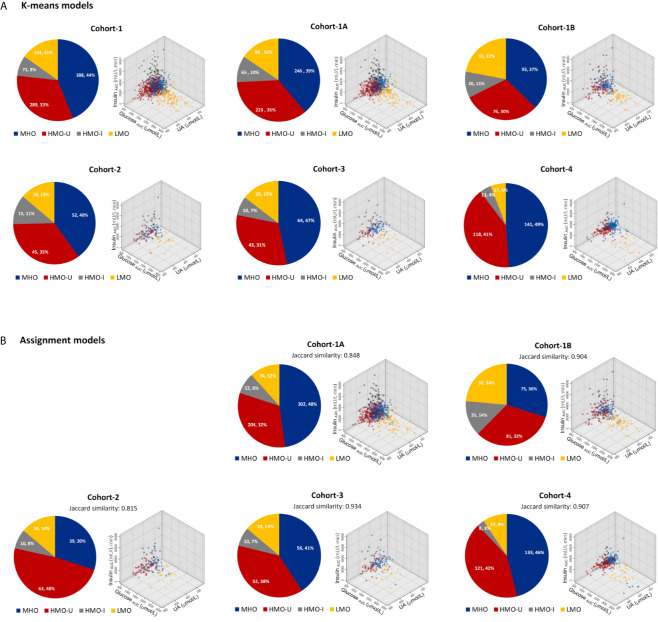
Figure 2.
Patient distributions and characteristics in each cohort with respect to the four clusters generated from machine learning. (A) Clusters generated independently from each individual cohort by using k-means. (B) Clusters generated by assigning patients in each verification cohort to the main model generated from Cohort-1. Data in the pie plots were shown as N (patient number) and its percentage over the full cohort. HMO-I, hypermetabolic obesity hyperinsulinemia subtype; HMO-U, hypermetabolic obesity hyperuricemia subtype; LMO, hypometabolic obesity; MHO, metabolic healthy obesity.

