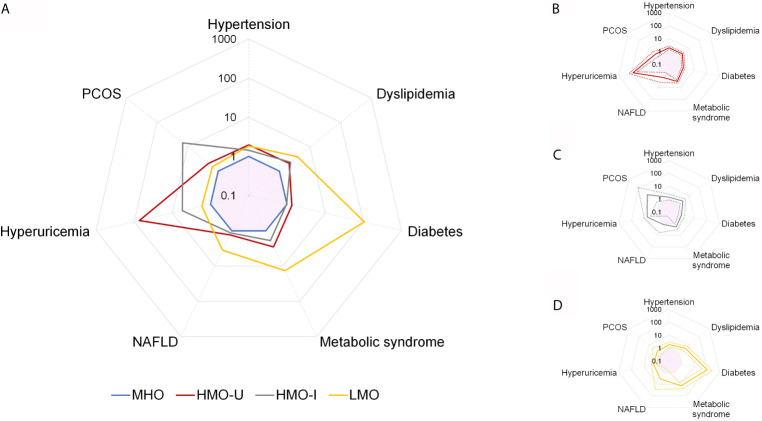
Figure 4.
Comparison of adjusted odds ratio (AOR) for obesity comorbidities across the four clusters generated from Cohort-1 using k-means. Comparison of AOR across the four clusters (A), and AOR and 95%CI for HMO-U (B), HMO-I (C), and LMO (D). MHO is used as the reference category. Analyses are adjusted for sex and age. Values are shown as AOR (solid line) and/or 95%CI (dash line). Pink shadow in the center of each spider diagram is area for AOR < 1. HMO-I, hypermetabolic obesity hyperinsulinemia subtype; HMO-U, hypermetabolic obesity hyperuricemia subtype; LMO, hypometabolic obesity; MHO, metabolic healthy obesity; NAFLD, nonalcoholic fatty liver disease; PCOS, polycystic ovary syndrome.

