
Figure 2. Changes in bulb squeeze duration, frequency, and amplitude during a 15-minute segment during menses in a dysmenorrhea participant before and after naproxen administration.
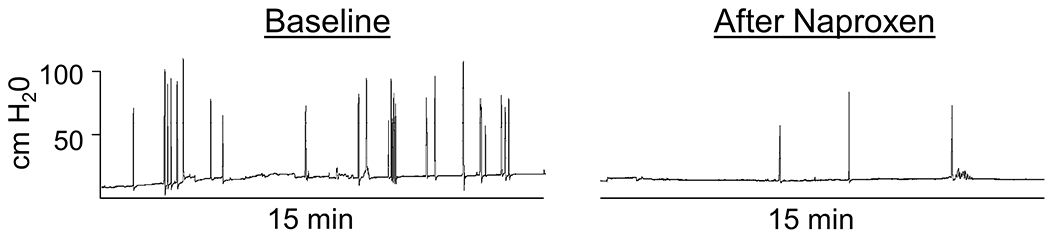
The Y axis (cm H20) is the same for both time points.
Official websites use .gov
A
.gov website belongs to an official
government organization in the United States.
Secure .gov websites use HTTPS
A lock (
) or https:// means you've safely
connected to the .gov website. Share sensitive
information only on official, secure websites.
The Y axis (cm H20) is the same for both time points.