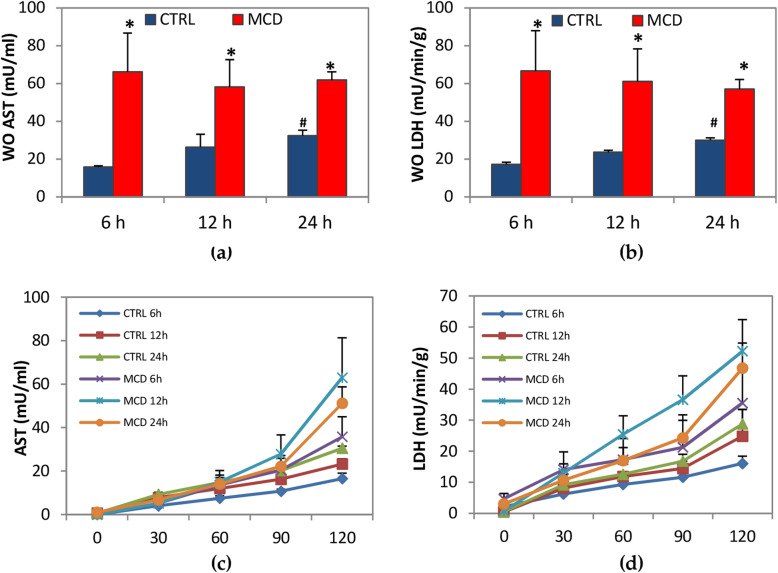
Fig. 2.
Enzyme release after the washout (WO) and during the reperfusion. Livers were preserved for 6, 12 or 24 h by CS, followed by 120 min reperfusion. (a) aspartate aminotransaminase (AST) in the WO; (b) lactate dehydrogenase (LDH) in the WO; (c) AST during reperfusion; (d) LDH during reperfusion. The data are presented as mean ± SE, n = 5/MCD groups, n = 4/control groups. For figure (a) and (b) the P value was calculated by one-way ANOVA with Tukey’s multiple comparison test. For figure (c) and (d) the P value was calculated by non-linear mixed models. *P ≤ 0.05 MCD vs its respective control; #P ≤ 0.05 control 24 h vs control 6 h

