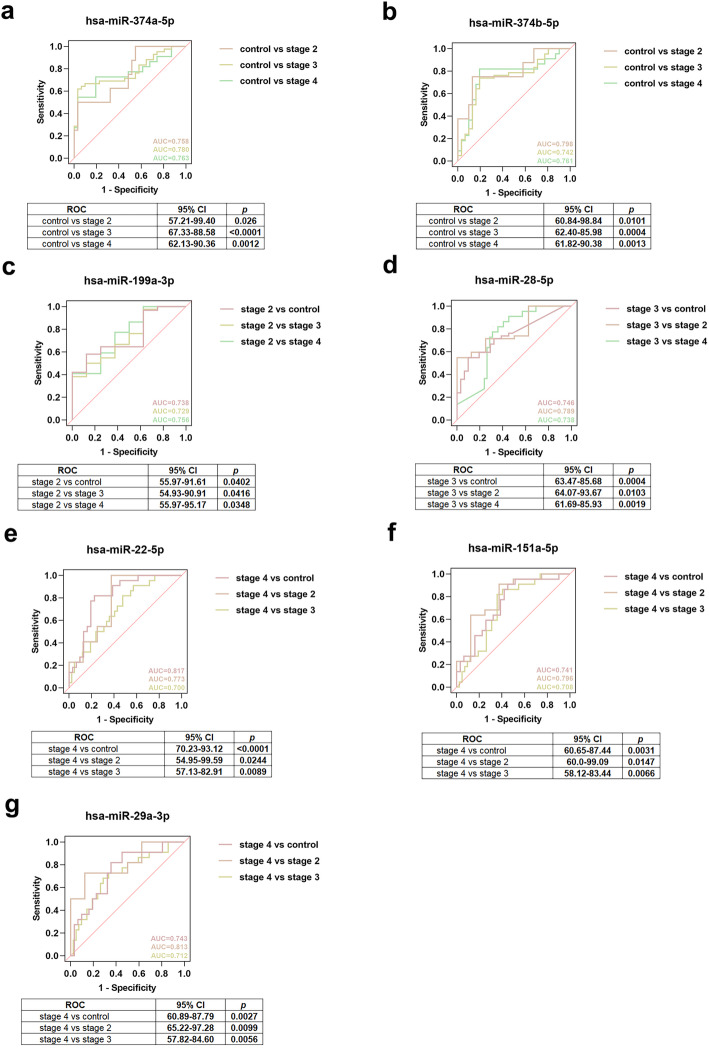
Fig. 4.
ROC curve analysis of screened miRNAs. a ROC curve of hsa-miR-374a-5p differentiating stage II, III or IV from control. b ROC curve of hsa-miR-374b-5p differentiating stage II, III or IV from control. c ROC curve of hsa-miR-199a-3p differentiating stage II from control, stage III or stage IV. d ROC curve of hsa-miR-28-5p differentiating stage III from control, stage II or stage IV. e ROC curve of hsa-miR-22-5p differentiating stage IV from control, stage II or stage III. f ROC curve of hsa-miR-151a-5p differentiating stage IV from control, stage II or stage III. g ROC curve of hsa-miR-29a-3p differentiating stage IV from control, stage II or stage III

