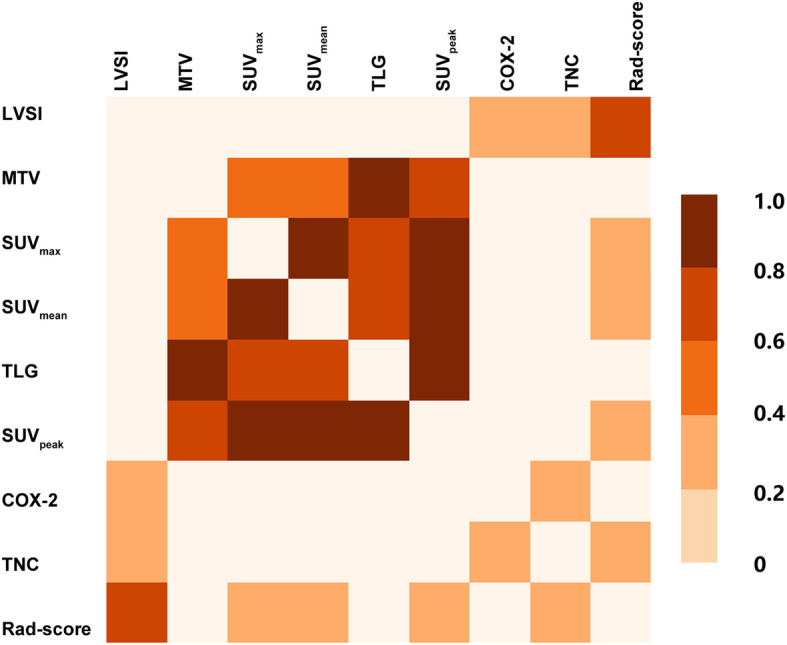
Fig. 4.

Heatmap of the correlation of LVSI, Rad-score, conventional parameters, TNC, and COX-2. The color scale on the right represents the interval of statistically significant regression coefficients. White squares indicate no statistical significance (p > 0.05). LVSI, lymphovascular space invasion; MTV, metabolic tumor volume; SUVmax, maximum of the standard uptake value; SUVmean, mean standard uptake value; TLG, total lesion glycolysis; SUVpeak, peak standard uptake value; COX-2, cyclooxygenase-2; TNC, tenascin-C; Rad-score, radiomics score
