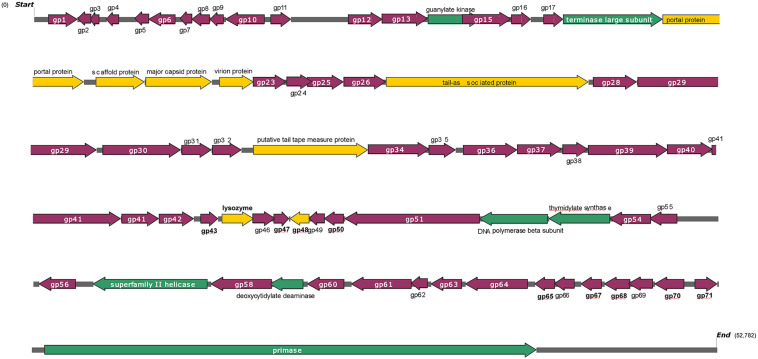
FIGURE 3.
Genome structure of phage swi3. The arrow represents the direction of transcription. Different colors represent open reading frames with different predictive functions. The structural proteins are represented in yellow, blue indicates cleavage-related proteins, the proteins associated with transcriptional transcription are expressed in green, and hypothetical proteins are represented in purple.

