
Figure 2.
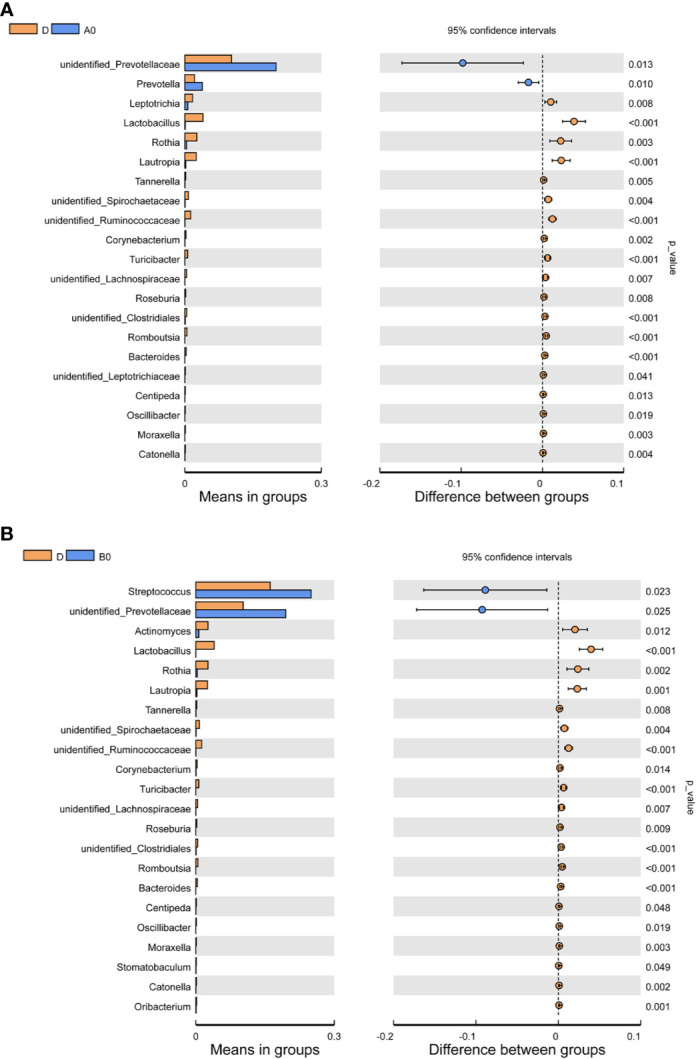
Comparisons of the relative abundance in oral microbiota at the genus level (A) Between A0 and D groups; (B) Between B0 and D groups. A0, people living with acute HIV infection at baseline; B0, people living with chronic HIV infection at baseline; D, HIV-uninfected controls; A12, people living with acute HIV infection after 12 weeks of ART; B12, people living with chronic HIV infection after 12 weeks of ART.