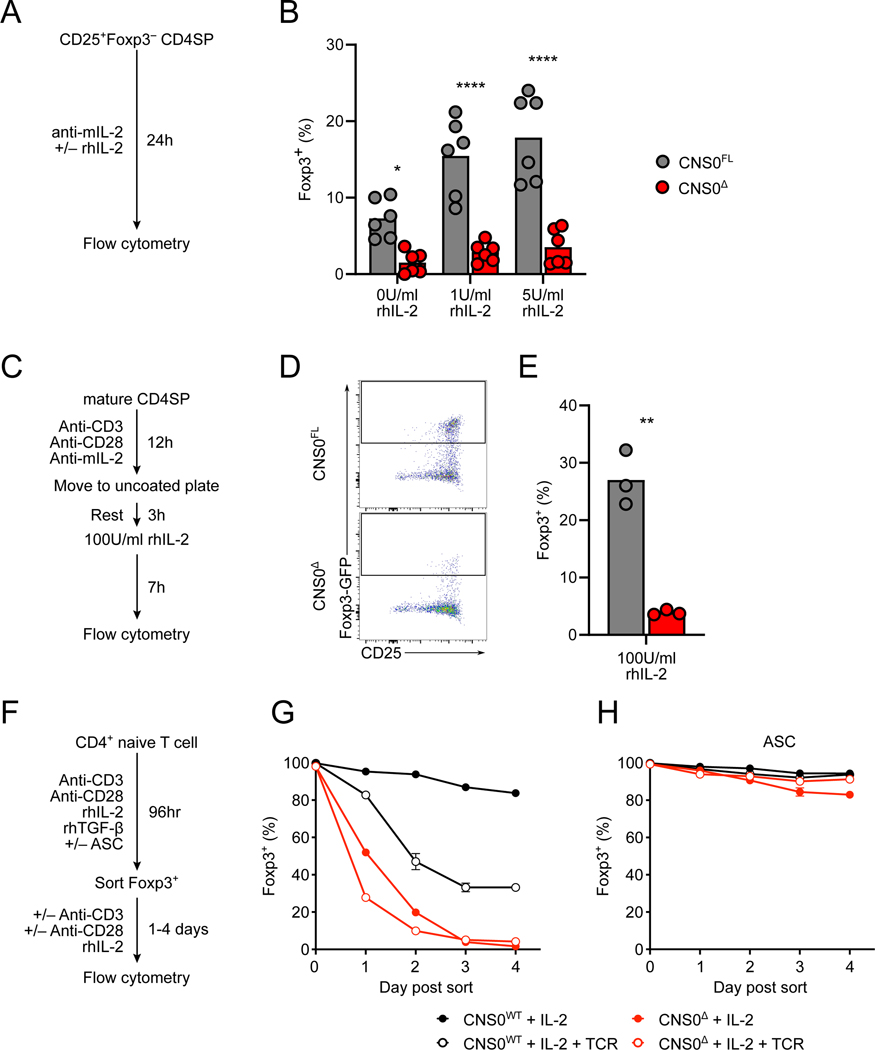
Figure 3. IL-2 dependent role of CNS0 in initiating and sustaining Foxp3 expression.
A. Schematic of experiments shown in (B). See STAR Methods for details.
B. Frequencies of Foxp3-GFP+ cells among Treg cell precursors (CD4+CD8−Foxp3-GFP− CD25+TCRβ+) sorted from the thymuses of 8-week-old CNS0FL or CNS0Δ male littermates incubated ex vivo with indicated amounts of IL-2 for 24 hours. Each point indicates 1 mouse and data are pooled from 2 independent experiments.
C. Schematic of experiments shown in (D-E). See STAR Methods for details.
D, E. Representative plots (D) and summarized data (E) of the frequencies of Foxp3-GFP+ cells among ex vivo stimulated mature CD4SP (CD4+CD8−CD73−Foxp3-GFP−CD25− TCRβhiCD24lo) cells sorted from the thymuses of 5- to 6-week-old CNS0FL or CNS0Δ male littermates. Each point indicates 1 mouse and data are representative of 3 independent experiments.
F. Schematic of experiments shown in (G, H). See STAR Methods for details.
G, H. Summarized data of the frequencies of Foxp3 expression by in vitro induced Treg cells after additional 4 days of culture. Treg cells were generated from Tn cells (CD4+Foxp3-GFP− CD62L+CD44−TCRβ+) in the absence (G) or presence (H) of sodium ascorbate (ASC). Plots show means and SD, n = 3 per group. Data represent >3 independent experiments.
</P/>Unpaired t-tests with correction for multiple comparisons using the Holm-Sidak method. p <0.05 *, <0.01 **, <0.0001 ****.
See also Figure S3.

