Abstract
The analysis of anatomy that undergoes rapid changes, such as neuroimaging of the early developing brain, greatly benefits from spatio-temporal statistical analysis methods to represent population variations but also subject-wise characteristics over time. Methods for spatio-temporal modeling and for analysis of longitudinal shape and image data have been presented before, but, to our knowledge, not for diffusion weighted MR images (DW-MRI) fitted with higher-order diffusion models. To bridge the gap between rapidly evolving DW-MRI methods in longitudinal studies and the existing frameworks, which are often limited to the analysis of derived measures like fractional anisotropy (FA), we propose a new framework to estimate a population trajectory of longitudinal diffusion orientation distribution functions (dODFs) along with subject-specific changes by using hierarchical geodesic modeling. The dODF is an angular profile of the diffusion probability density function derived from high angular resolution diffusion imaging (HARDI) and we consider the dODF with the square-root representation to lie on the unit sphere in a Hilbert space, which is a well-known Riemannian manifold, to respect the nonlinear characteristics of dODFs. The proposed method is validated on synthetic longitudinal dODF data and tested on a longitudinal set of 60 HARDI images from 25 healthy infants to characterize dODF changes associated with early brain development.
1. Introduction
The understanding of subject-wise anatomical change driven by a biological process is important for diagnosis of neurological disorders or planning of therapeutic intervention. The need is even more significant when the timing of diagnosis and therapeutic planning is critical due to the rapid rate of anatomical change, e.g. in the early developing brain of an infant at risk of autism. The longitudinal analysis of anatomical change has recently gained more attention because of its ability to provide analysis of subject-wise anatomical changes while also estimating of a population trend, in addition to accounting for the inherent correlation of longitudinal data [12, 22, 15, 17, 16].
Most recent clinical studies involve longitudinal data acquisition where multiple repeated scans of individual subjects are acquired. Because repeated scans of an individual subject are inherently correlated, conventional cross-sectional analysis assuming independence of given data is not suitable to be applied to longitudinal data. So far, spatio-temporal statistical analysis methods were suggested and broadly used for longitudinal data derived from medical images to study a representative anatomical change of a population of medical images [24, 8, 14, 29]. However, spatio-temporal analysis of higher-order diffusion models of high angular resolution diffusion imaging (HARDI) images has not been extensively studied until recently.
In [19], authors presented a framework for longitudinal multi-shell HARDI image analysis which includes time and orientation resolved multi-tissue average template building. A consistent atlas building of longitudinal HARDI images was suggested in [18]. These studies mainly focused on reflecting temporal differences of images of different age groups rather than constructing a fully continuous longitudinal atlas. There was an attempt to create a continuous longitudinal atlas using spherical harmonics (SPHARM) coefficients of diffusion orientation distribution function (dODF) [16] which showed the continuous change of dODFs in the corpus callosum. However, the method is limited by the fact that an estimated atlas might include invalid dODFs due to the application of linear mixed effects modeling to individual SPHARM coefficients without considering the characteristics of a dODF as a probability density function (PDF).
In this paper, we present a method to estimate a representative change of longitudinal dODFs using hierarchical geodesic modeling [25, 17, 15]. A dODF, a diffusion PDF on a sphere, is expressed on a Riemannian manifold as suggested in [13, 6]. A subject-specific spatio-temporal trajectory of dODFs is estimated by geodesic modeling with a series of dODFs from repeatedly observed HARDI images of an individual subject. The population-level longitudinal change is then estimated from the set of subject-specific trajectories via hierarchical modeling to account for repeated data. We validate the feasibility of the proposed method with a synthetic example of longitudinal dODFs. The proposed method was applied to a longitudinal set of 60 HARDI images from 25 healthy infants from a real-world clinical study in order to estimate a normative longitudinal trajectory of healthy infant brain development as expressed with diffusion imaging.
2. Method
2.1. Square-Root dODF on the Sphere Manifold
The dODF, f(s), , is an angular profile of the diffusion probability density function (PDF), which is a non-negative and normalized function of water molecule motion on the unit sphere. The square-root representation of dODF results in manifold valued data lying on the unit sphere in a Hilbert space with L2 metric [26]. In this paper, the manifold-valued dODF is defined as and determined in the space , . In practice, a dODF is discretely sampled from the unit 2-sphere [11] with approximately equal area. We assume that the samples are d evenly distributed points from the domain unit 2-sphere of a dODF. A discretized dODF is then represented as a d-dimensional point y, which satisfies , where a is the area that each sampled point of dODF represents on the 2-sphere. Since the area a is constant, we can simply normalize all dODFs y to be on the surface of the unit (d − 1)-sphere that satisfies . Then a square-root dODF can be expressed on the d − 1-sphere manifold, . We used a symmetric sphere with 724 vertices.
A sphere manifold is a well-known Riemannian manifold with constant curvature of 1.0. A geodesic is a zero acceleration curve on a Riemannian manifold M. Each point p on M is associated with a tangent vector space TpM. Let v be a tangent vector on TpM, v ∈ TpM. An exponential map Exp(p, v) = q is a mapping function that maps p along a geodesic that starts from p in the direction and magnitude of v for a unit time. The exponential map of the sphere manifold is given by rotation of p by the norm of v, , where θ = ∥v∥. A Riemannian log map between two points Log(p, q) = v is the inverse of the exponential map that returns a tangent vector v ∈ TpM of a geodesic that connects p and q. The log map of Sd−1 is the initial velocity of the rotation between the two points, , where θ = arccos(⟨p, q⟩) and πp(q) = p⟨p, q⟩ [10]. A Riemannian distance between two points d(p, q) measures the length of the geodesic between p and q, which is the norm of v, d(p, q) = ∥v∥ = ∥Log(p, q)∥. Parallel transport ψp→q(v) transports a tangent vector v ∈ TpM from one point p ∈ M to another point q ∈ M along a geodesic between p and q while preserving the angle and the scale of v.
2.2. Hierarchical geodesic model
A linear mixed effect model is a statistical model reflecting both fixed effects and random effects that are variables randomly distributed across individual subjects in a longitudinal study or groups from a hierarchical structure in Euclidean space [9]. In our case, given longitudinal observations of a non-linear response variable on the sphere manifold, we estimate subject-specific and population-level changes by hierarchical geodesic modeling (HG) [15, 25, 17, 1]. The HG model estimates subject-specific longitudinal trajectories from repeatedly observed dODFs of individual subjects, and in turn, estimates a population-level spatio-temporal change from the collection of subject-wise trajectories.
Subject-wise trajectory
A subject-wise trajectory and the corresponding least squares criterion are written as
| (1) |
where yij ∈ M is the ith subject’s jth observation, Nobs,i the number of observations of the subject i, pi ∈ M the intercept, vi ∈ TpiM the slope tangent vector, and the observation time. Eq. 1 is solved by the alternating naive tangent space approximation method [15].
Hierarchical geodesic model
A population trajectory is given as
| (2) |
| (3) |
where the ith subject’s optimized intercept and slope are denoted and , and Nsubj is the number of subjects. The least squares formulation on the left of Eq. 3 assumes that the subject-wise intercept is distributed around following the Riemannian normal distribution of the intercept’s random effects: , where [28]. The least squares formulation of the right of Eq. 3 represents the random effects of slope. As we need to bring the subject-wise tangent vectors to the same tangent space before estimating the slope , the tangent vector is parallel transported to , denoted as . The distance function is the standard L2 norm on .
3. Experimental validations and results
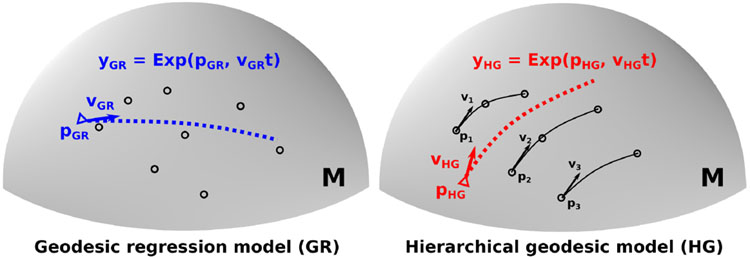
The difference between a geodesic regression (GR) model and a hierarchical geodesic (HG) model for a series of longitudinal data on a sphere manifold M is illustrated in Fig. 1. Due to the inherent correlation of longitudinal data, the random effects of subjects should be reflected in estimating a population trajectory. A GR model assumes data independence thus the model cannot capture longitudinal changes correctly while an HG model contains the random effects of slope and intercept. In the following, we validate our method with synthetic longitudinal dODF, and demonstrate clinical application using longitudinal HARDI images of the developing infant brain.
Fig. 1.
Illustration of geodesic regression model (Left) and hierarchical geodesic model (Right) with random effects from the correlation of longitudinal data. Each subject has a different intercept and slope (Black lines, Right).
Synthetic longitudinal dODFs
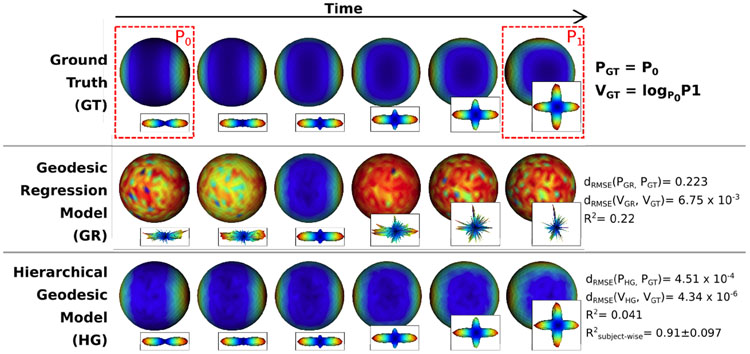
We construct a series of synthetic longitudinal dODF data to evaluate the performance of the HG model and compare with the result from GR. We establish a ground truth geodesic by the logarithm map from a dODF with a single peak P0 to a dODF with perpendicular crossing peaks P1, V = Log(P0, P1) (First row, Fig. 2) [6]. The two dODFs P0 and P1 were generated by the multi-tensor method with 6th order real spherical harmonics [5]. A total of 2470 dODFs of 1000 subjects with two or three observations associated with time points ranged between 0 and 15 were generated by Eq. 2 with the random effects on intercepts ϵP ~ N(0, 0.0052) and slopes ϵV ~ N(0, 0.0012), and the data observation error ϵ ~ N(0, 0.0052). In addition to the random effects on the intercepts, we injected additional variation to perturb subject-wise intercept points along a tangent vector perpendicular to the tangent vector V. This is intended to demonstrate feasibility of the proposed method to handle subject-specific variations which mimick the scenario of Fig. 1.
Fig. 2.
Synthetic example of longitudinal dODF. Color mapped spheres represent dODF values and the glyphs next to the spheres are radially scaled shapes. (Row 1) Ground truth. The red dashed boxes show P0 with a single direction and P1 with crossing fibers. The ground truth geodesic follows the tangent vector V = logP0P1. (Row 2) Estimated geodesic regression model. (Row 3) Estimated hierarchical geodesic model.
Fig. 2 shows the estimated geodesic of the GR model (Second row, Fig. 2) and the HG model (Third row, Fig. 2). The HG model successfully estimated the ground truth population trajectory by accounting for the longitudinal effect while the estimated GR model did not provide a suitable result. The R2 of HR and GR with respect to the ground truth geodesic were 0.041 and 0.22 respectively. The relatively low R2 value of the estimated HG model is not surprising because R2 does not take into account the longitudinal effect, it just measures the ratio of the explained variance to the total variance of an entire population. The average R2 value of the subject-wise trajectories of the HG model was 0.91 ± 0.097 (a comparable value cannot be measured by GR). We calculated the root mean square error (RMSE) from the ground truth to the estimated intercept and slope from the models. For intercept and slope, the RMSE from the HG model were 4.51 × 10⁻⁴ and 4.34 × 10⁻⁶ respectively, which are orders of magnitude lower than those of the GR model with RMSE of 0.223 and 6.75 × 10⁻³ for intercept and slope. These results quantitatively confirm the better fit of the HG model and clearly show that geodesic regression may not be a suitable model for longitudinal dODFs.
Longitudinal DW images of developing infant brain
The brain undergoes rapid structural changes due to axonal maturation, which is also expressed by developing cortical folding, presenting asymptotic growth at an early age [7, 21]. Several longitudinal studies have investigated early maturation of white matter (WM) measured by fractional anisotropy (FA) and mean diffusivity (MD) [22, 3], but less is known about how the dODF changes with age. We apply our new method to a longitudinal set of 60 HARDI brain images from 25 healthy developing infants with an age range from 3 to 25 months, scanned on 3-T Siemens TIM Trio, with 64 directional DWI volumes sampled on the half sphere, b-value at 2000s/mm2, and 2 × 2 × 2mm3 voxel resolution, followed by preprocessing and multivariate atlas building similarly to [16]. Manifold-valued dODFs are obtained voxel-wise from all HARDI images aligned in the common atlas space. We re-parametrize subject age by taking the natural log to model the asymptotic development of the infant brain [7].
One benefit of the analysis of dODF is that it provides information on brain maturation by derived measurements, such as generalized fractional anisotropy (GFA) or peaks of the ODFs [4, 27] rather than modeling derived measures independently. We analyze the estimated trajectories of dODFs and derived measures in selected anatomical regions of white matter including genu (GCC) and splenium (SCC) of the corpus callosum, anterior limb of the internal capsule (ALIC), posterior limb of the internal capsule (PLIC), and brain regions with crossing fibers where corpus callosum (CC) and corticospinal tracts (CST) pass. Myelination of the selected regions is known to occur during early development [7, 21].
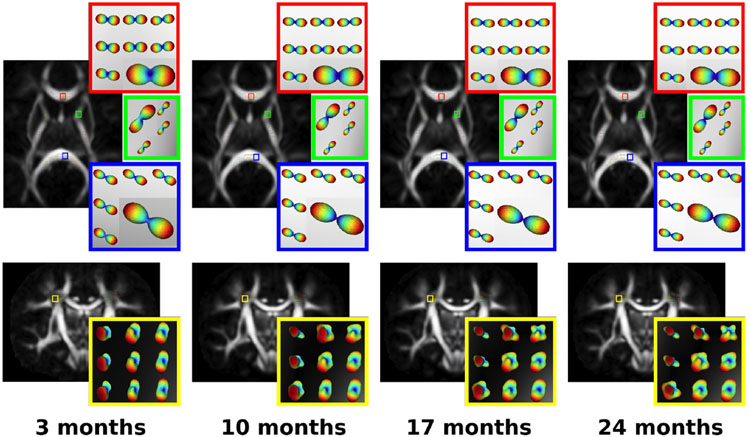
Fig. 3 illustrates the voxel-wise population geodesic trend of the estimated dODF changes over age in the selected WM regions. The dODF shapes become sharper in the GCC, SCC, and ALIC as age increases. The change is even more pronounced in the crossing fiber region (Fig. 3, Bottom row). The map of the derived GFA indices is shown in the background of dODFs displaying that GFA indices are lower in the crossing fiber regions (bottom row) than those in regions where dODFs had one peak (top row). The overall R2 values of GR and HG are 0.27 and 0.26 respectively and the overall subject-wise R2 of HG was 0.92.
Fig. 3.
Population geodesic trajectory of longitudinal dODFs superimposed on generalized fractional anisotropy (GFA) in early developing infants sampled at different ages. Red, green, blue and yellow boxes show changes in the genu of corpus callosum (GCC), the anterior limb of the internal capsule (ALIC), the splenium of corpus callosum (SCC) and the region with crossing fibers where corticospinal tracts and corpus callosum (CC) pass, respectively. Larger glyphs are used for enhanced visualization.
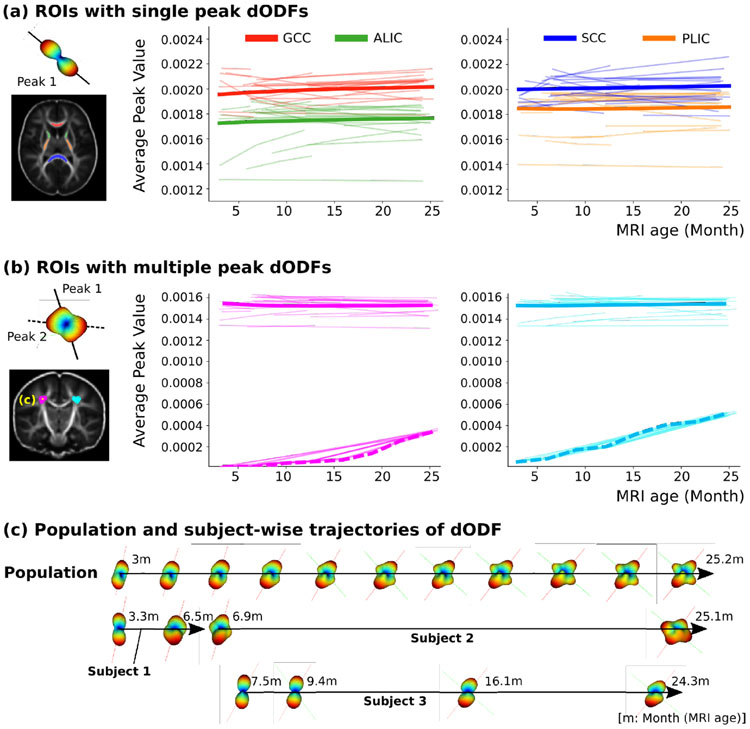
The results of the changes of dODF peaks, also known as maxima, from the estimated HG model are illustrated in Fig. 4. The peak values of GCC and ALIC are slightly increased while the SCC and PLIC did not show any change as shown in Fig. 4(a). The flat slope may indicate that the maturation of the SCC and PLIC begins earlier compared to the GCC and ALIC. The slight increase in the slope of the single peaks may be induced from large individual variability which is an observation also reported in another recent longitudinal study [20]. This variability may be a combination of factors related to brain development and scanner variability not captured by our model. Fig. 4(b) shows the peak value of ROIs with crossing fibers. The second peak value increases in both left and right hemispheres while the first peak stays similar over time. This result suggests that the dODF trajectory is reflecting crossing fiber development in much more detail than the derived measures, as is also illustrated in Fig. 4(c).
Fig. 4.
Changes of peak diffusion of dODFs estimated from geodesic trajectories. (a) Results from ROIs with the dODF having a single peak with genu of corpus callosum (GCC), splenium of corpus callosum (SCC), anterior limb of the internal capsule (ALIC), and posterior limb of the internal capsule (PLIC). (b) Results of the crossing fiber regions having multiple peaks. (c) Example of the dODF trajectories of the population and three selected subjects was taken at one voxel marked in yellow from the crossing fiber ROI. Primary (red) and secondary (green) peaks from the population-level trajectory are illustrated with the dODFs.
4. Conclusion
We propose a new hierarchical geodesic modeling (HG) of diffusion orientation distribution function (dODF) for longitudinal analysis of diffusion weighted MR images (DW-MRI). The proposed method estimates a population trajectory and also subject-specific trajectories of the age-related change of dODFs, which are represented as square root manifold-valued data to respect the nonlinear characteristics of dODFs. We showed via synthetic data that the geodesic regression model is not suitable for the analysis of longitudinal dODFs, demonstrating the importance of properly modeling intra-subject correlation. The application to a real-world data offered promising results that supported clinical findings of early brain growth from a population trajectory of dODFs. The method is generic and applicable to any longitudinal set of dODF data for the analysis of a temporal change of dODFs related to early development, degeneration, or disease progression. The HG model on dODFs enables analysis of derived information, such as generalized fractional anisotropy (GFA) or tractography-based analysis, which has been broadly used for longitudinal analysis of DW-MRI. As this method provides a basis for creating a normative model, there are several directions for future works such as hypothesis testing for longitudinal group differences between a disease group and controls or prediction of physiological age. Also, future perspective for the methodology will be to develop a better longitudinal model for dODF, for example, a REML-like-mixed-effect model [1, 2, 23].
Acknowledgements
This work was supported by the NIH grants R01-HD055741-12, 1R01HD089390-01A1, 1R01DA038215-01A1 and 1R01HD088125-01A1.
Footnotes
Conflict of Interest Statement The authors declare that there are no conflicts or commercial interest related to this article.
References
- 1.Allassonnière S, Chevallier J, Oudard S: Learning spatiotemporal piecewisegeodesic trajectories from longitudinal manifold-valued data. In: Advances in Neural Information Processing Systems. pp. 1152–1160 (2017) [Google Scholar]
- 2.Bône A, Colliot O, Durrleman S: Learning distributions of shape trajectories from longitudinal datasets: a hierarchical model on a manifold of diffeomorphisms. In: IEEE Conference on Computer Vision and Pattern Recognition. pp. 9271–9280 (2018) [Google Scholar]
- 3.Chen Y, An H, Zhu H, Jewells V, Armao D, Shen D, Gilmore JH, Lin W: Longitudinal regression analysis of spatial–temporal growth patterns of geometrical diffusion measures in early postnatal brain development with diffusion tensor imaging. Neuroimage 58(4), 993–1005 (2011) [DOI] [PMC free article] [PubMed] [Google Scholar]
- 4.Cohen-Adad J, Descoteaux M, Wald LL: Quality assessment of high angular resolution diffusion imaging data using bootstrap on q-ball reconstruction. Journal of Magnetic Resonance Imaging 33(5), 1194–1208 (2011) [DOI] [PMC free article] [PubMed] [Google Scholar]
- 5.Descoteaux M, Angelino E, Fitzgibbons S, Deriche R: Regularized, fast, and robust analytical q-ball imaging. Magnetic Resonance in Medicine: An Official Journal of the International Society for Magnetic Resonance in Medicine 58(3), 497–510 (2007) [DOI] [PubMed] [Google Scholar]
- 6.Du J, Goh A, Kushnarev S, Qiu A: Geodesic regression on orientation distribution functions with its application to an aging study. NeuroImage 87, 416–426 (2014) [DOI] [PubMed] [Google Scholar]
- 7.Dubois J, Dehaene-Lambertz G, Kulikova S, Poupon C, Hüppi PS, Hertz-Pannier L: The early development of brain white matter: a review of imaging studies in fetuses, newborns and infants. Neuroscience 276, 48–71 (2014) [DOI] [PubMed] [Google Scholar]
- 8.Durrleman S, Pennec X, Trouvé A, Braga J, Gerig G, Ayache N: Toward a comprehensive framework for the spatiotemporal statistical analysis of longitudinal shape data. International journal of computer vision 103(1), 22–59 (2013) [DOI] [PMC free article] [PubMed] [Google Scholar]
- 9.Fitzmaurice GM, Laird NM, Ware JH: Applied longitudinal analysis, vol. 998. John Wiley & Sons; (2012) [Google Scholar]
- 10.Fletcher PT: Geodesic regression and its application to shape analysis. In: Innovations for Shape Analysis, pp. 35–52. Springer; (2013) [Google Scholar]
- 11.Garyfallidis E, Brett M, Amirbekian B, Rokem A, Van Der Walt S, Descoteaux M, Nimmo-Smith I: Dipy, a library for the analysis of diffusion mri data. Frontiers in neuroinformatics 8, 8 (2014) [DOI] [PMC free article] [PubMed] [Google Scholar]
- 12.Gerig G, Fishbaugh J, Sadeghi N: Longitudinal modeling of appearance and shape and its potential for clinical use. Med Image Anal 33, 114–121 (October 2016) [DOI] [PMC free article] [PubMed] [Google Scholar]
- 13.Goh A, Lenglet C, Thompson PM, Vidal R: A nonparametric riemannian framework for processing high angular resolution diffusion images (hardi). In: IEEE Conference on Computer Vision and Pattern Recognition. pp. 2496–2503. IEEE; (2009) [Google Scholar]
- 14.Guizard N, Fonov VS, García-Lorenzo D, Nakamura K, Aubert-Broche B, Collins DL: Spatio-temporal regularization for longitudinal registration to subject-specific 3d template. PloS one 10(8) (2015) [DOI] [PMC free article] [PubMed] [Google Scholar]
- 15.Hong S, Fishbaugh J, Wolff JJ, Styner MA, Gerig G, Network I, et al. : Hierarchical multi-geodesic model for longitudinal analysis of temporal trajectories of anatomical shape and covariates. In: International Conference on Medical Image Computing and Computer-Assisted Intervention. pp. 57–65. Springer; (2019) [DOI] [PMC free article] [PubMed] [Google Scholar]
- 16.Kim H, Styner M, Piven J, Gerig G: A framework to construct a longitudinal dw-mri infant atlas based on mixed effects modeling of dodf coefficients. In: International Conference on Medical Image Computing and Computer-Assisted Intervention. Springer; (2019) [Google Scholar]
- 17.Kim HJ, Adluru N, Suri H, Vemuri BC, Johnson SC, Singh V: Riemannian nonlinear mixed effects models: Analyzing longitudinal deformations in neuroimaging. In: IEEE Conference on Computer Vision and Pattern Recognition. pp. 2540–2549 (2017) [DOI] [PMC free article] [PubMed] [Google Scholar]
- 18.Kim J, Chen G, Lin W, Yap PT, Shen D: Graph-constrained sparse construction of longitudinal diffusion-weighted infant atlases. In: International Conference on Medical Image Computing and Computer-Assisted Intervention. pp. 49–56. Springer; (2017) [DOI] [PMC free article] [PubMed] [Google Scholar]
- 19.Pietsch M, Christiaens D, Hutter J, Cordero-Grande L, Price AN, Hughes E, Edwards AD, Hajnal JV, Counsell SJ, Tournier JD: A framework for multi-component analysis of diffusion mri data over the neonatal period. NeuroImage 186, 321–337 (2019) [DOI] [PMC free article] [PubMed] [Google Scholar]
- 20.Reynolds JE, Grohs MN, Dewey D, Lebel C: Global and regional white matter development in early childhood. Neuroimage 196, 49–58 (2019) [DOI] [PubMed] [Google Scholar]
- 21.Rutherford MA: MRI of the Neonatal Brain. Elsevier Health Sciences; (2002) [Google Scholar]
- 22.Sadeghi N, Prastawa M, Fletcher PT, Wolff J, Gilmore JH, Gerig G: Regional characterization of longitudinal dt-mri to study white matter maturation of the early developing brain. Neuroimage 68, 236–247 (2013) [DOI] [PMC free article] [PubMed] [Google Scholar]
- 23.Schiratti JB, Allassonniere S, Colliot O, Durrleman S: A bayesian mixed-effects model to learn trajectories of changes from repeated manifold-valued observations. The Journal of Machine Learning Research 18(1), 4840–4872 (2017) [Google Scholar]
- 24.Serag A, Aljabar P, Ball G, Counsell SJ, Boardman JP, Rutherford MA, Edwards AD, Hajnal JV, Rueckert D: Construction of a consistent high-definition spatio-temporal atlas of the developing brain using adaptive kernel regression. NeuroImage 59(3), 2255–2265 (2012) [DOI] [PubMed] [Google Scholar]
- 25.Singh N, Hinkle J, Joshi S, Fletcher PT: Hierarchical geodesic models in diffeomorphisms. International Journal of Computer Vision 117(1), 70–92 (2016) [Google Scholar]
- 26.Srivastava A, Jermyn I, Joshi S: Riemannian analysis of probability density functions with applications in vision. In: IEEE Conference on Computer Vision and Pattern Recognition. pp. 1–8. IEEE; (2007) [DOI] [PMC free article] [PubMed] [Google Scholar]
- 27.Van Hecke W, Emsell L, Sunaert S: Diffusion tensor imaging: a practical handbook. Springer; (2015) [Google Scholar]
- 28.Zhang M, Fletcher T: Probabilistic principal geodesic analysis. In: Advances in Neural Information Processing Systems. pp. 1178–1186 (2013) [Google Scholar]
- 29.Zhang Y, Shi F, Wu G, Wang L, Yap PT, Shen D: Consistent spatial-temporal longitudinal atlas construction for developing infant brains. IEEE transactions on medical imaging 35(12), 2568–2577 (2016) [DOI] [PMC free article] [PubMed] [Google Scholar]


