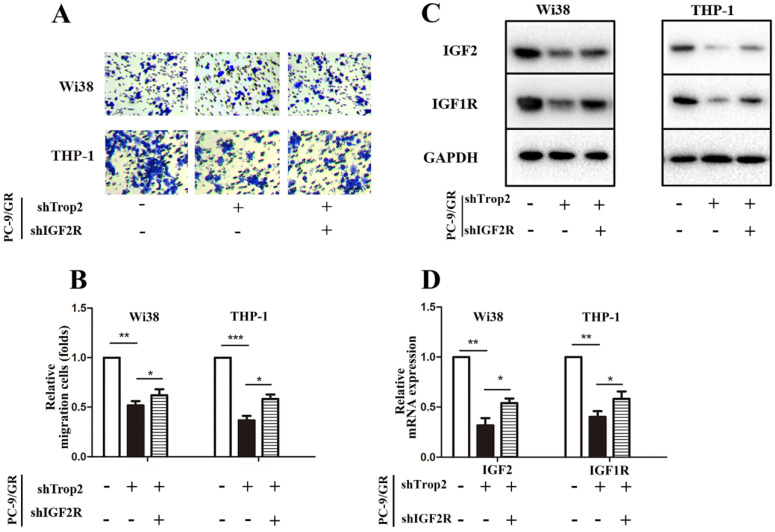
Figure 5.
Trop2 activated IGF2 to reshape tumor microenvironment in NSCLC gefitinib resistance. (A-B) Co-culture system through migration assay, Wi38 or THP-1 cells were added in upper chamber, and PC-9/GR, PC-9/GR shTrop2 or PC-9/GR shTrop2+shIGF2R were added in lower chamber with gefitinib treatment for 24 h or 48 h; (A) Representative images of the cell migration were shown; (B) is the statistical graph of (A). (C) The protein levels of IGF2 and IGF1R were detected at 48 h in Wi38 and THP-1 cells. (D-E) The mRNA levels of IGF2 and IGF1R at 24 h in Wi38 and THP-1 cells. Mean ± SD, *P<0.05, **P<0.01, ***P<0.001.

