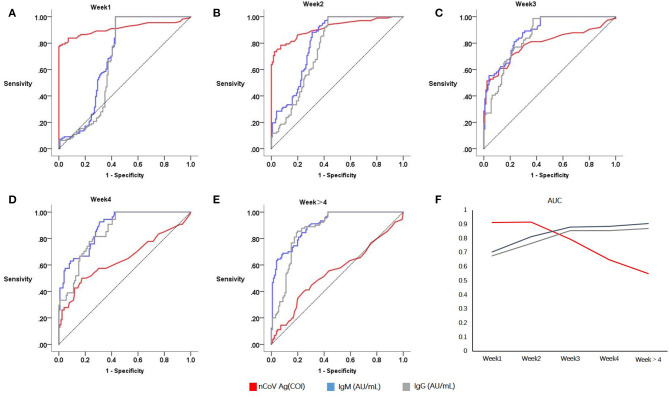
Figure 2.
Sensitivities and specificities analysis of serological testing for COVID-19 diagnosis. Red denotes serum antigen, blue and grey denotes specific antibodies IgM and IgG, respectively. Receiver operating curves of Week1 (A), Week2 (B), Week3 (C), Week4 (D), Week > 4 (E); Area under curves relate to the time of onset (F).

