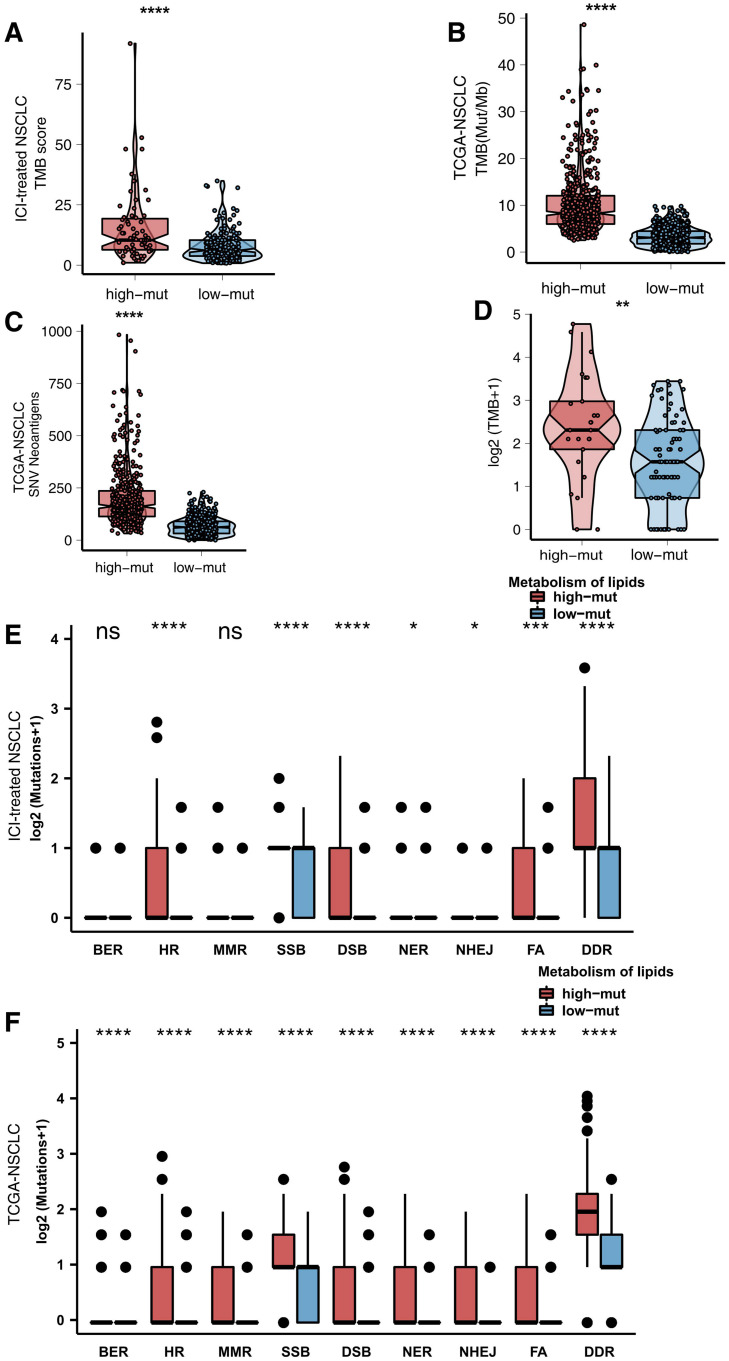
FIGURE 4.
(A) Comparison of TMB scores between the high and low mutation groups in the ICI-treated cohort (Rizvi et al., 2018). (B) Comparison of TMB between the high and low mutation groups in the TCGA cohort. (C) Comparison of TMB between the high and low mutation groups in the Local-NSCLC cohort. (D) Comparison of NAL between the high and low mutation groups in the TCGA cohort. (E) Comparison of DNA damage-related gene set alterations between the high and low mutation groups in the ICI-treated cohort (Rizvi et al., 2018). (F) Comparison of DNA damage-related gene set alterations between the high and low mutation groups in the TCGA cohort.

