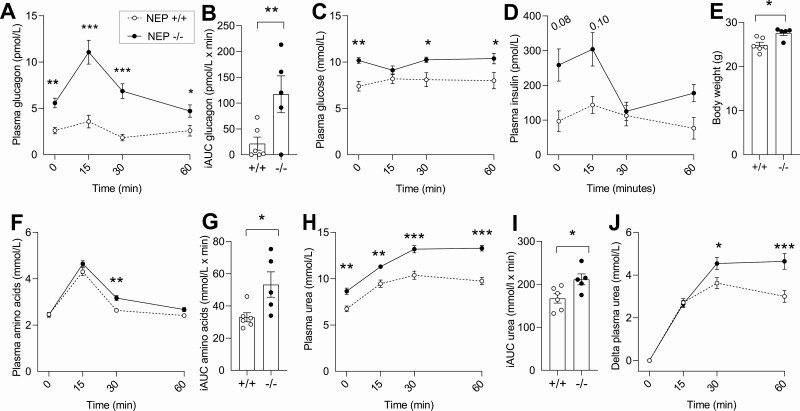
Figure 4.
Neprilysin (NEP)-deficient mice have increased fasting and amino acid-stimulated glucagon and urea concentrations. Plasma concentrations of A, glucagon and B, corresponding incremental areas under the curve (iAUCs); C, blood glucose concentrations, plasma concentrations of D, insulin; E, body weight; plasma concentrations of F, amino acids; and G, corresponding iAUCs, plasma concentrations of H, urea; and I, corresponding iAUCs; and plasma concentrations of J, ∆ urea in male NEP–/– mice (black circles) and NEP+/+ mice (open circles)-challenged amino acids (equivalent to 1% of body weight) at time 0 minutes (n = 5-6). Data are presented as mean ± SEM and are analyzed by A, C, D, F, H, and J, repeated-measures 2-way analysis of variance, and B, E, G and I, unpaired t tests. –/– indicates NEP–/– mice and +/+ indicates NEP+/+ mice.

