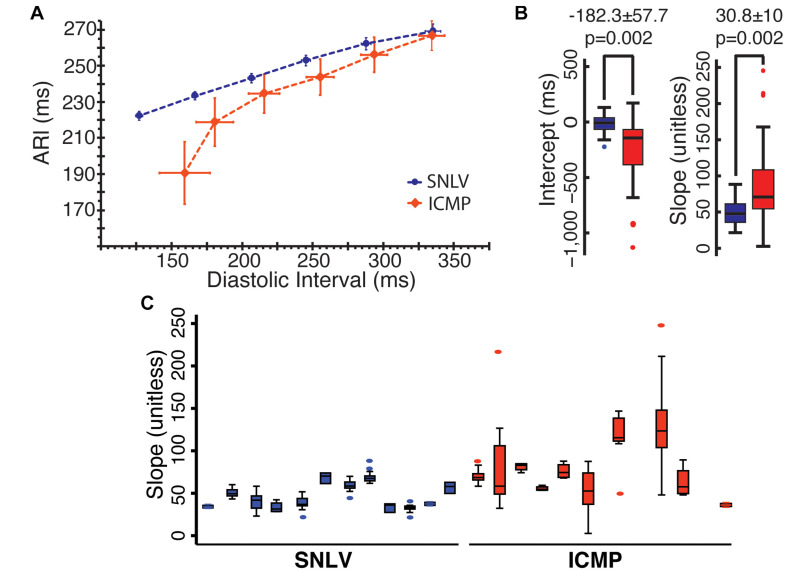
FIGURE 1.
(A) ARI over DI in patients with SNLV (blue) and ICMP (red). Points represent mean values and error bars represent 95% confidence intervals. ARI, activation recovery interval in ms; DI, diastolic interval in ms. (B) Box-plots demonstrating the distribution of clinically obtained APDR intercept (in ms) and slope (unitless) in patients with SNLV (blue) and ICMP (red). Box-plots summarize the intercept and slope of the clinically obtained APDR curve fitted at each UniEGM recording of each patient. p-values are derived from mixed model analysis as described in the main text. (C) Box-plots of the clinically obtained APDR slope in each individual SNLV and ICMP patient, demonstrating the within- and between-subject variability of clinically obtained APDR slope.

