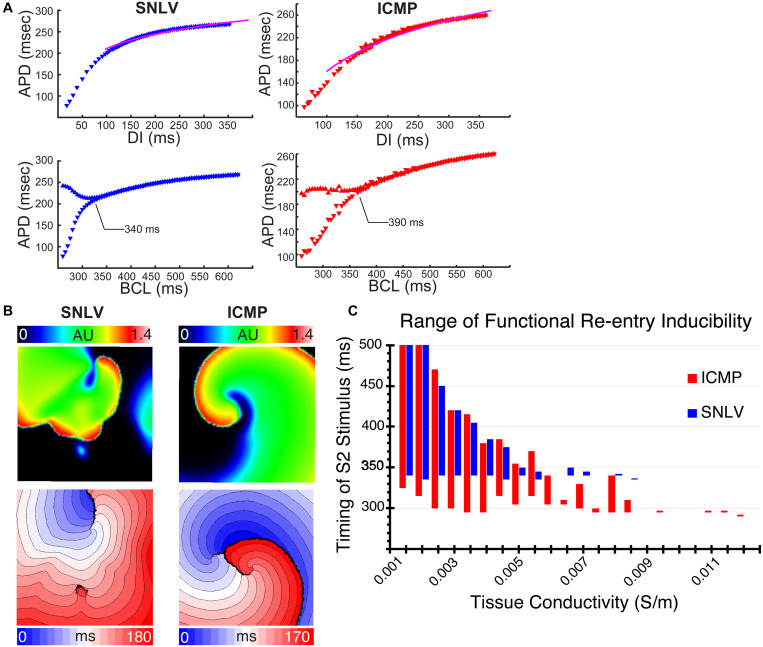
FIGURE 3.
(A) Cell-level simulations of the best-fit GA-derived SNLV (blue) and ICMP (red) model. The first row demonstrates the APDR. The pink line is the patient derived average APDR curve. These plots demonstrate good fit of the models to patient data. The second row demonstrates bifurcation plots for SNLV and ICMP models. The onset of APD alternans (development of bifurcation) is annotated. APD alternans occur at slower cycle lengths in the ICMP model compared to SNLV suggesting a more proarrhythmic behavior. (B) Tissue-level simulation using a conductivity of 0.009 S/m and S1S2 interval of 330 ms for the SNLV model and 295 ms for the ICMP model. Non-sustained functional re-entry was induced in the SNLV model while sustained functional re-entry was induced in the ICMP. Upper row: snapshot of the simulation, color represents transmembrane voltage in arbitrary units. Lower row: activation isochrone maps for simulations using SNLV and ICMP models; each isochrone represents 10 ms. (C) Range of functional re-entry inducibility of the SNLV (blue) and ICMP (red) best-fit models. X-axis represents different tissue conductivity values in Siemens/m and Y-axis represents S1S2 coupling intervals that resulted in sustained functional re-entry. The best-fit ICMP model has a wider range of S1–S2 intervals, for all conductivity values, that result in sustained functional re-entry suggesting a more proarrhythmic behavior.

