. 2021 Jun 25;12(29):10054–10062. doi: 10.1039/d1sc02259h

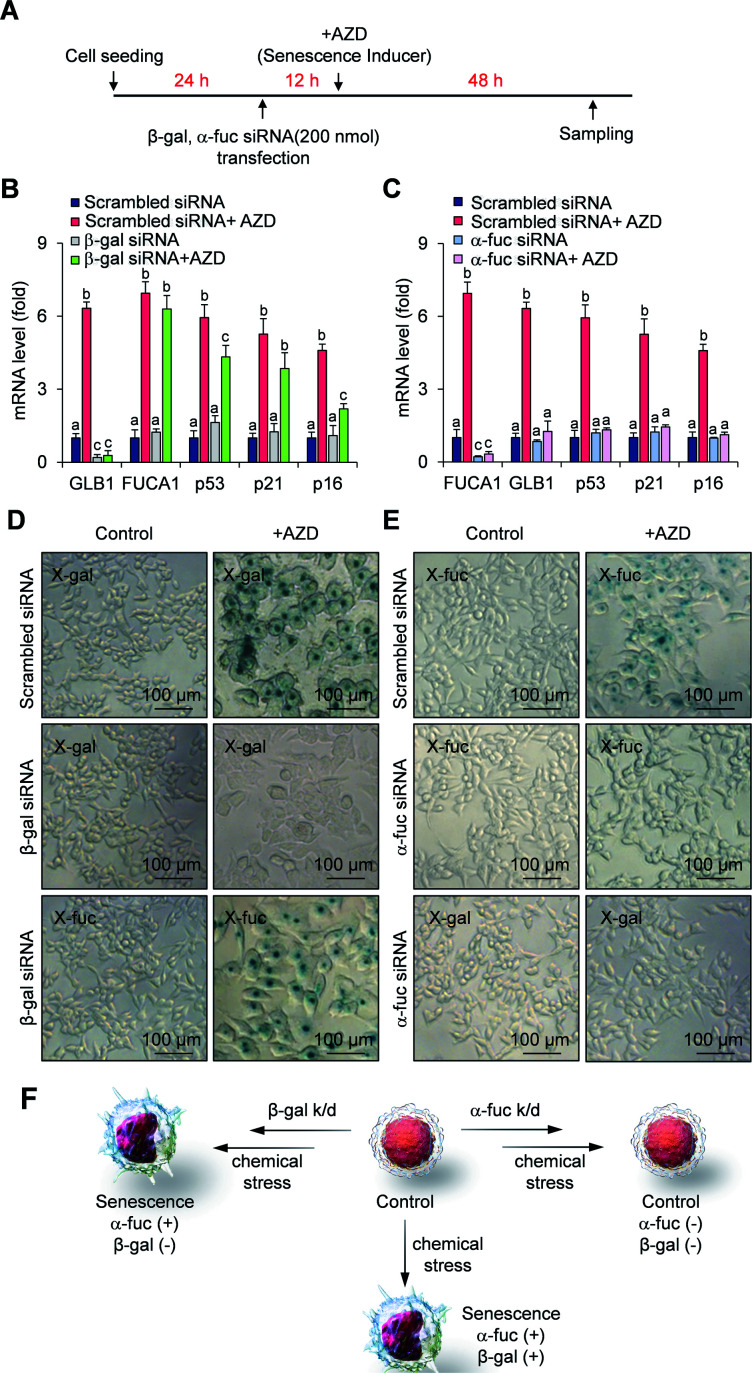
Fig. 3. Fidelity assessment of α-fuc as a novel senescence biomarker. (A) Experimental design for the assessment of senescence induction in GLB1/FUCA1-knockdown cells. (B) mRNA expression of GLB1, FUCA1, p53, p21, and p16 in GLB1-knockdown cells. (C) mRNA expression of GLB1, FUCA1, p53, p21, and p16 in FUCA1-knockdown cells. (D) Chromogenic X-gal and X-fuc assay in GLB1-knockdown cells. (E) Chromogenic X-gal and X-fuc assay in FUCA1-knockdown cells. (F) Schematic illustration showing correlation of α-fuc and β-gal expression with onset of senescence. Data are represented as mean ± SEM (n = 3 in B and C). Statistical significance was determined by a two-way ANOVA test with a post hoc Bonferroni test. Different letters (e.g., a–c) signify datasets that are statistically distinct (p < 0.05).

Fig. 3