. 2021 Jun 25;12(29):10054–10062. doi: 10.1039/d1sc02259h

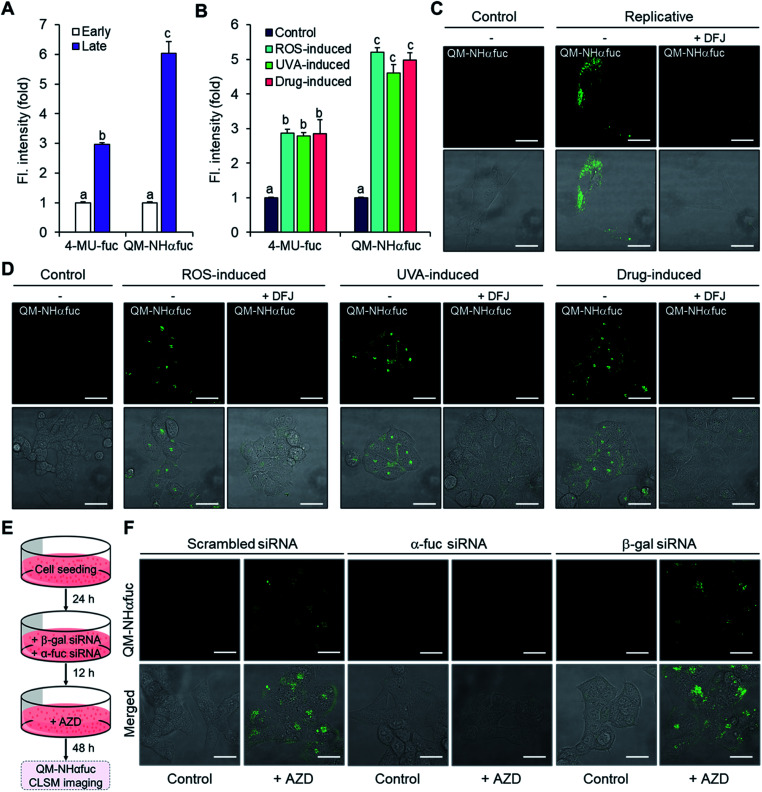
Fig. 5. In vitro real-time imaging of senescent cells using QM-NHαfuc. (A) Change in the fluorescence (senescent vs. control) of 4-MU-fuc (30 μM) and QM-NHαfuc (30 μM) in replicative senescent cells. (B) Change in the fluorescence (senescent vs. control) of 4-MU-fuc (30 μM) and QM-NHαfuc (30 μM) in ROS-, UVA-, drug-induced senescent cells. (C) CLSM images of replicative senescent cells using QM-NHαfuc (30 μM) with and without pre-treatment of DFJ (100 μM). Scale bar = 50 μm. (D) CLSM images of ROS-, UVA-, drug-induced senescent cells using QM-NHαfuc (30 μM) with and without pre-treatment of DFJ (100 μM). Scale bar = 50 μm. (E) Experimental design for the CLSM studies of AZD treated GLB1-knockdown and FUCA1-knockdown cells using QM-NHαfuc (30 μM). (F) CLSM images of AZD treated GLB1-knockdown and FUCA1-knockdown cells using QM-NHαfuc (30 μM). Scale bar = 50 μm. Data are represented as mean ± SEM (n = 3 in A and B). Statistical significance was determined by a two-way ANOVA test with a post hoc Bonferroni test. Different letters (e.g., a–c) signify datasets that are statistically distinct (p < 0.05).

Fig. 5