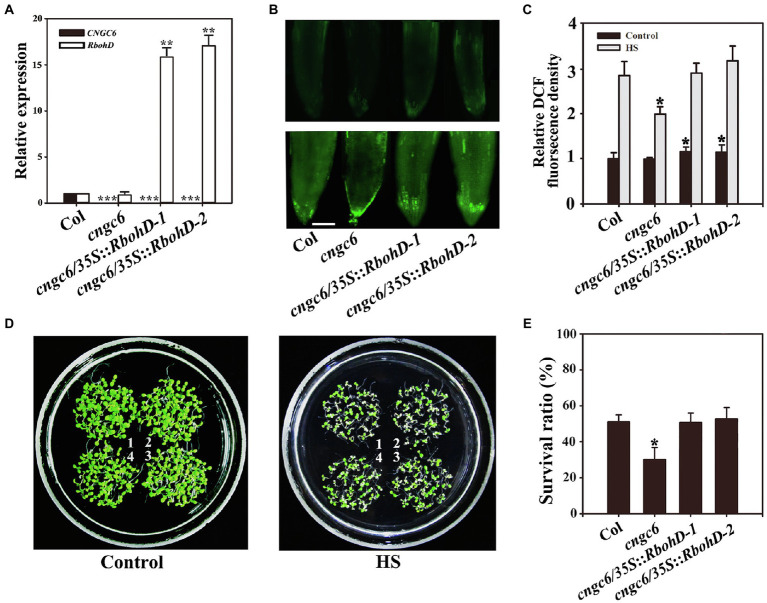
Figure 4.
Improved thermotolerance through AtRbohD overexpression in a cngc6 background. (A) RT-qPCR analysis of AtCNGC6 and AtRbohD transcription in wild-type, cngc6, cngc6/35S::RbohD-1, and cngc6/35S::RbohD-2 plants. The experiments were repeated three times with similar results. Each data point represents the mean ± SD (n = 3). Asterisks indicate a significant difference relative to Col (Student’s t-test: **p < 0.01 and ***p < 0.001). (B) About 8-day-old wild-type, cngc6, cngc6/35S::RbohD-1, and cngc6/35S::RbohD-2 seedlings grown at 22°C were exposed to 45°C (HS) or maintained at 22°C (Control) for 30 min. The H2O2 levels in the plants were then examined by fluorescence microscopy using roots stained with CM-H2DCFDA. Bar = 100 μm. (C) The relative DCF fluorescence densities in the roots. The data presented are the means ± SE of measurements taken from five independent experiments with at least 10 roots for each treatment. *p < 0.05 vs. Col. (D) Seedlings grown at 22°C were exposed to 45°C (HS) or maintained at 22°C (Control) for 100 min, then returned to 22°C and photographed 5 days later. The clusters are as follows: 1, wild-type; 2, cngc6; 3, cngc6/35S::RbohD-1; and 4, cngc6/35S::RbohD-2. (E) Survival ratios of the seedlings after HS treatment. The data presented are the means ± SE of at least five independent experiments with 50 seedlings per experiment. *p < 0.05 vs. Col (Student’s t-test).

