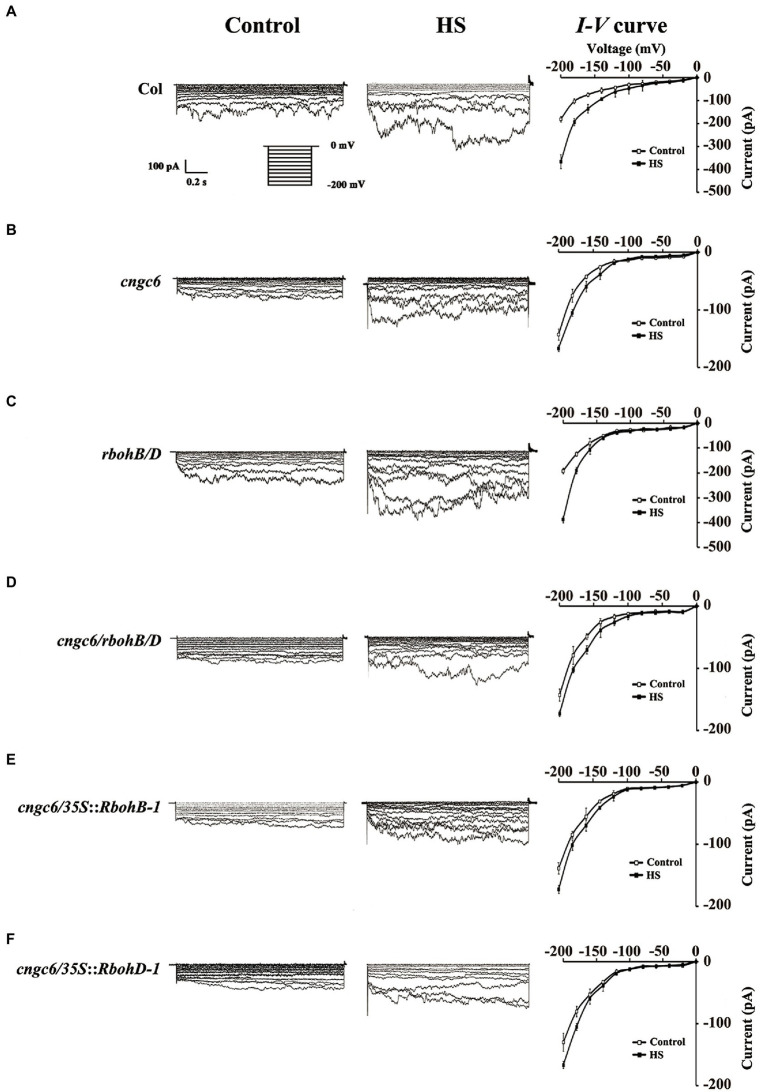
Figure 6.
Patch-clamp analysis of Ca2+-permeable channels in wild-type, cngc6, rbohB/D, cngc6/rbohB/D, cngc6/35S::RbohB-1, and cngc6/35S::RbohD-1 seedlings. The Ca2+ current before HS (at 22°C, control) and after HS (at 37°C, HS) was compared in the root cell protoplasts of 8-day-old wild-type (A), cngc6 (B), rbohB/D (C), cngc6/rbohB/D (D), cngc6/35S::RbohB-1 (E), and cngc6/35S::RbohD-1 (F) plants. The Ca2+ current was recorded by step voltage clamp. Each trace is a representative current from six protoplasts. Currents in the protoplasts are shown in the left and middle columns, respectively. The I–V curve is shown in the right column (mean ± SD, n = 6).

