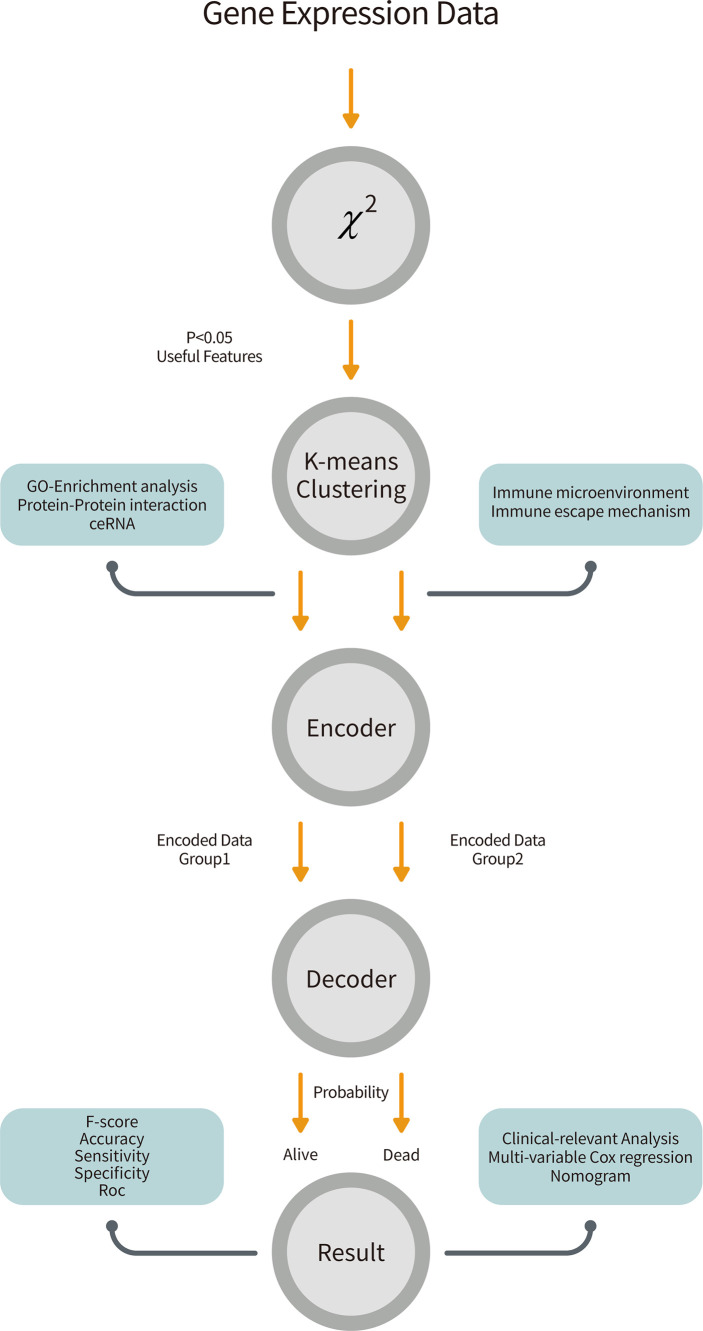
Figure 1.
The overall workflow of our pipeline. Gene expression data from GSE49710 was retrieved and performed a chi-square test to filter 172 features. The K-means clustering method partitioned patients and genes into two groups. We trained two neural networks for two groups of features and combined them by the attention mechanism to predict survivals. Further, we analyzed biological effects between two groups and did clinical-relevant analysis.

