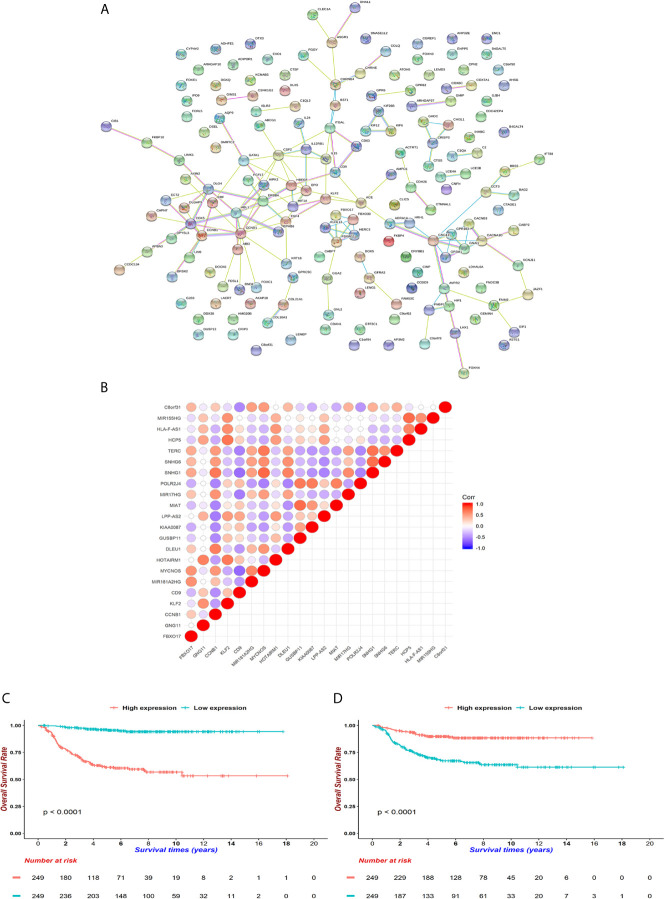
Figure 6.
Underlying hub genes and associated interactions in neuroblastoma. (A) The protein-protein-interaction (PPI) network was constructed by String website. (B) Mutual correlations among 18 hub genes filtered by cytoHubba module in Cytoscape software. The dots are colored red when Pearson correlation coefficients approach 1 and dots are colored blue when coefficients reach -1. (C, D) KM curves for CCNB1 and CD9 (D). Expressions were cut by median levels. (both log-rank test p < 0.0001, n = 498).

