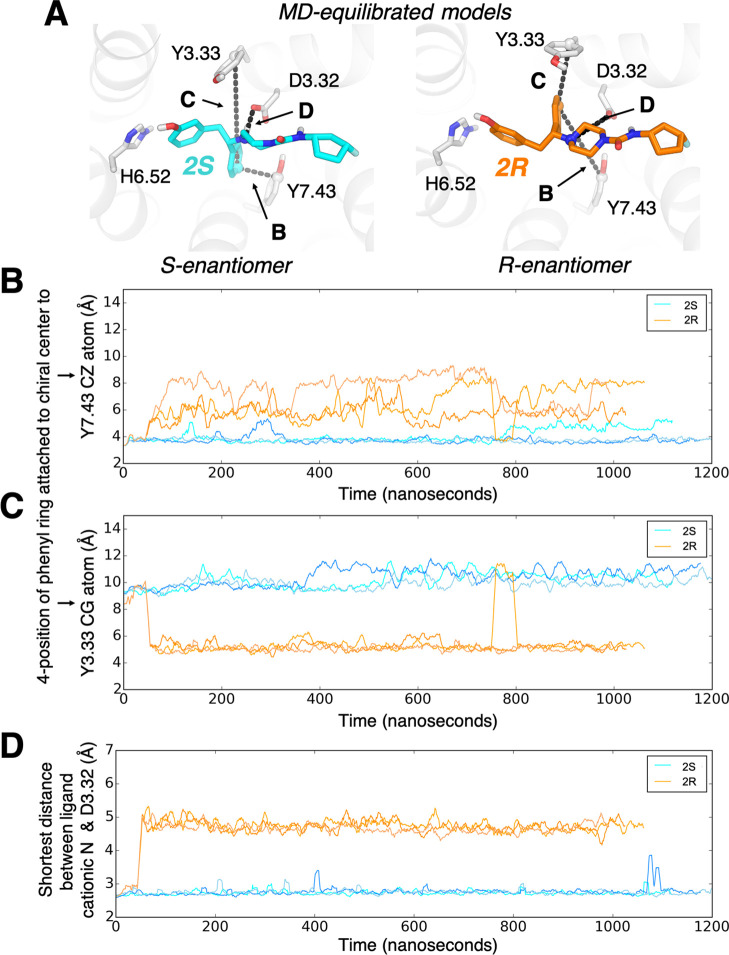
Figure 3.
In simulation, R- and S-enantiomers form different stable interactions with the receptor. (A) The poses of 2S (left) and 2R (right) adopted in MD simulations. In 2R, the phenyl group attached to the chiral center breaks an initial interaction with Y7.43 (maintained in 2S) to instead engage Y3.33. Panels (B)–(D) quantify ligand–receptor interactions by showing interatomic distances throughout each simulation. (B) Distance between the 4-position of the phenyl ring attached to the chiral center and the ζ carbon of Y7.43. (C) Distance between the 4-position of the phenyl ring attached to the chiral center and the γ carbon of Y3.33. (D) Shortest distance between the ligand cationic nitrogen and either side-chain oxygen of D3.32.

