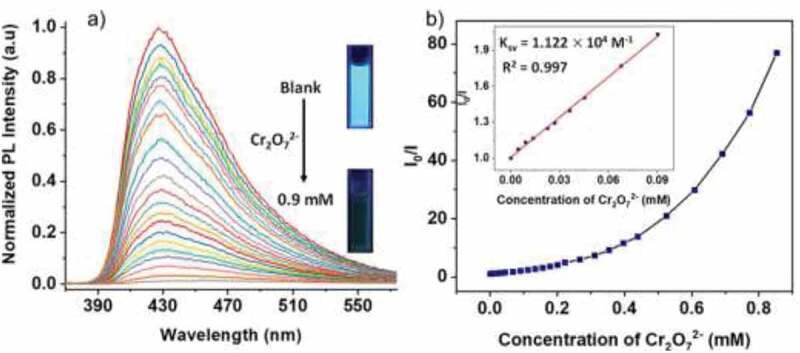
Figure 4.

(a) Complex 1’s photoluminescence spectra and (b) the diagram of Stern–Volmer plot increased gradually with the Cr2O72– ions concentration in the water. The linearity of quenching in a low range of concentration is reflected in the illustration
