
Figure 2.
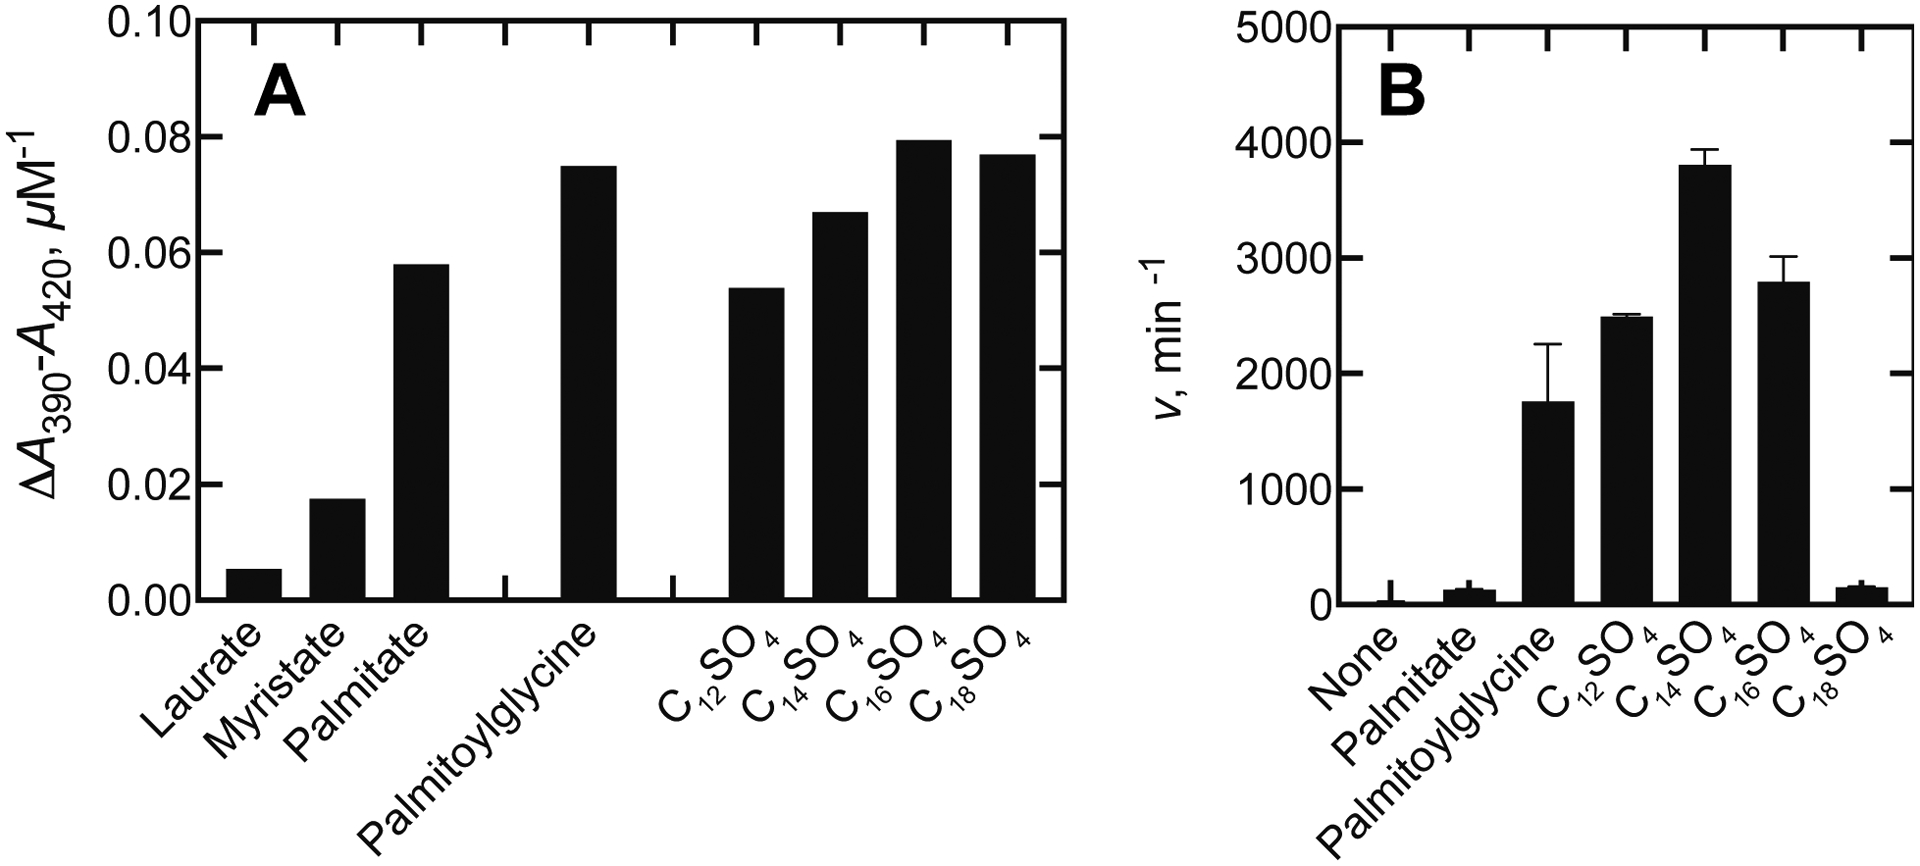
Initial screens of fatty acids and alkyl sulfates by P450BM-3. A. Initial comparisons of the extent of Type I difference spectral changes of P450BM-3 with fatty acids and alkyl sulfates. All values are expressed as ΔA390-A420 units per μM P450 BM-3 (done with 1 or 2 μM P450BM-3 and 500 μM concentrations for laurate and myristate, 200 μM in the case of dodecyl sulfate (C12SO4, 50 μM for other alkyl sulfates–C14, C16, C18). B. Rates (v) were determined by oxidation of NADPH (ΔA340) and are presented as means ± SD of triplicate assays (nmol NADPH oxidized/min/nmol P450BM-3 (units equivalent to “ min−1”). The substrate concentration was 200 μM in each case.