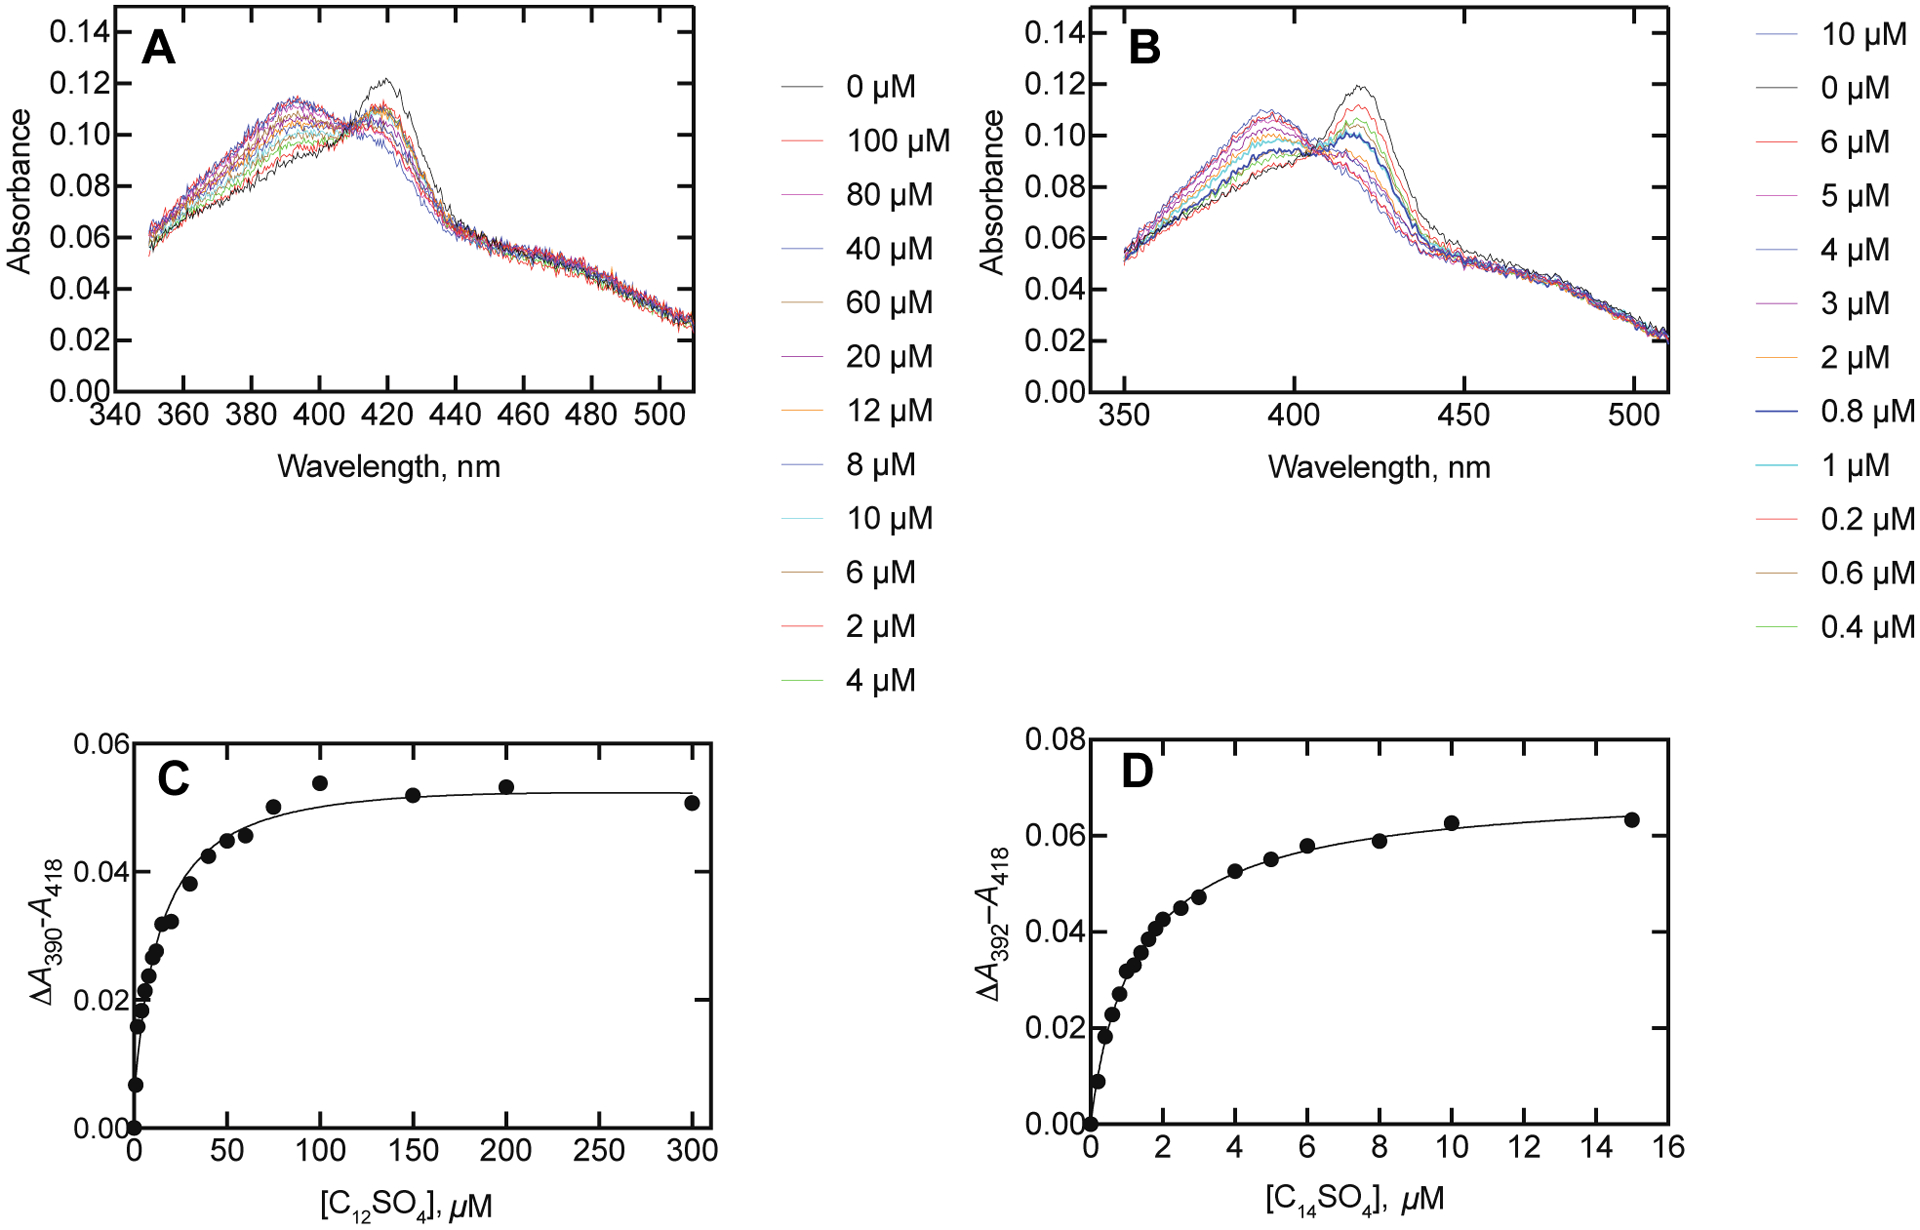
Figure 3.

P450BM-3 spectral changes observed during titrations with alkyl sulfates. A. Dodecyl sulfate. B. Tetradecyl sulfate. The P450BM-3 concentration was 1.0 μM and the additions of the alkyl sulfates (final concentrations) are indicated in the colored legends. Plots of spectral titrations of P450BM-3 with alkyl sulfates: C. Dodecyl sulfate (Kd 14 ± 2 μM). D. Tetradecyl sulfate (Kd 1.4 ± 0.1 μM). For Part D, see Figure S1 of the Supporting Information for the P450BM-3 second derivative spectra.
