
Figure 8.
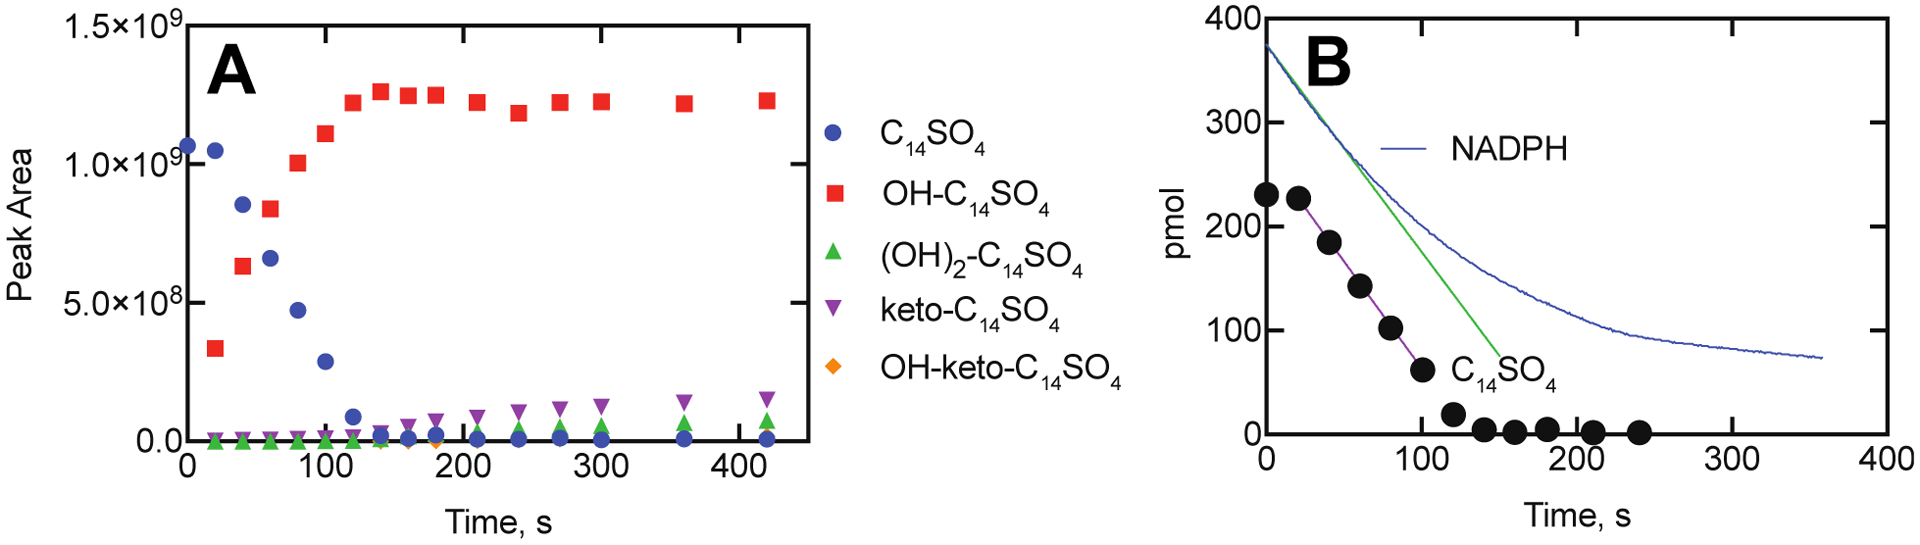
Time course of oxidation of tetradecyl sulfate by P450BM-3. A. Disappearance of tetradecyl sulfate (blue circles) and appearance of monohydroxy (red squares) and other oxidized products (identified in Figs. 5, 7). B. Comparison of rates of disappearance of NADPH (blue line, A340, with initial rate indicated with green line, 1.75 pmol s−1) and tetradecyl sulfate (filled circles, with maximal rate between 20 and 100s indicated with purple line, 1.65 pmol s−1).