
Figure 9.
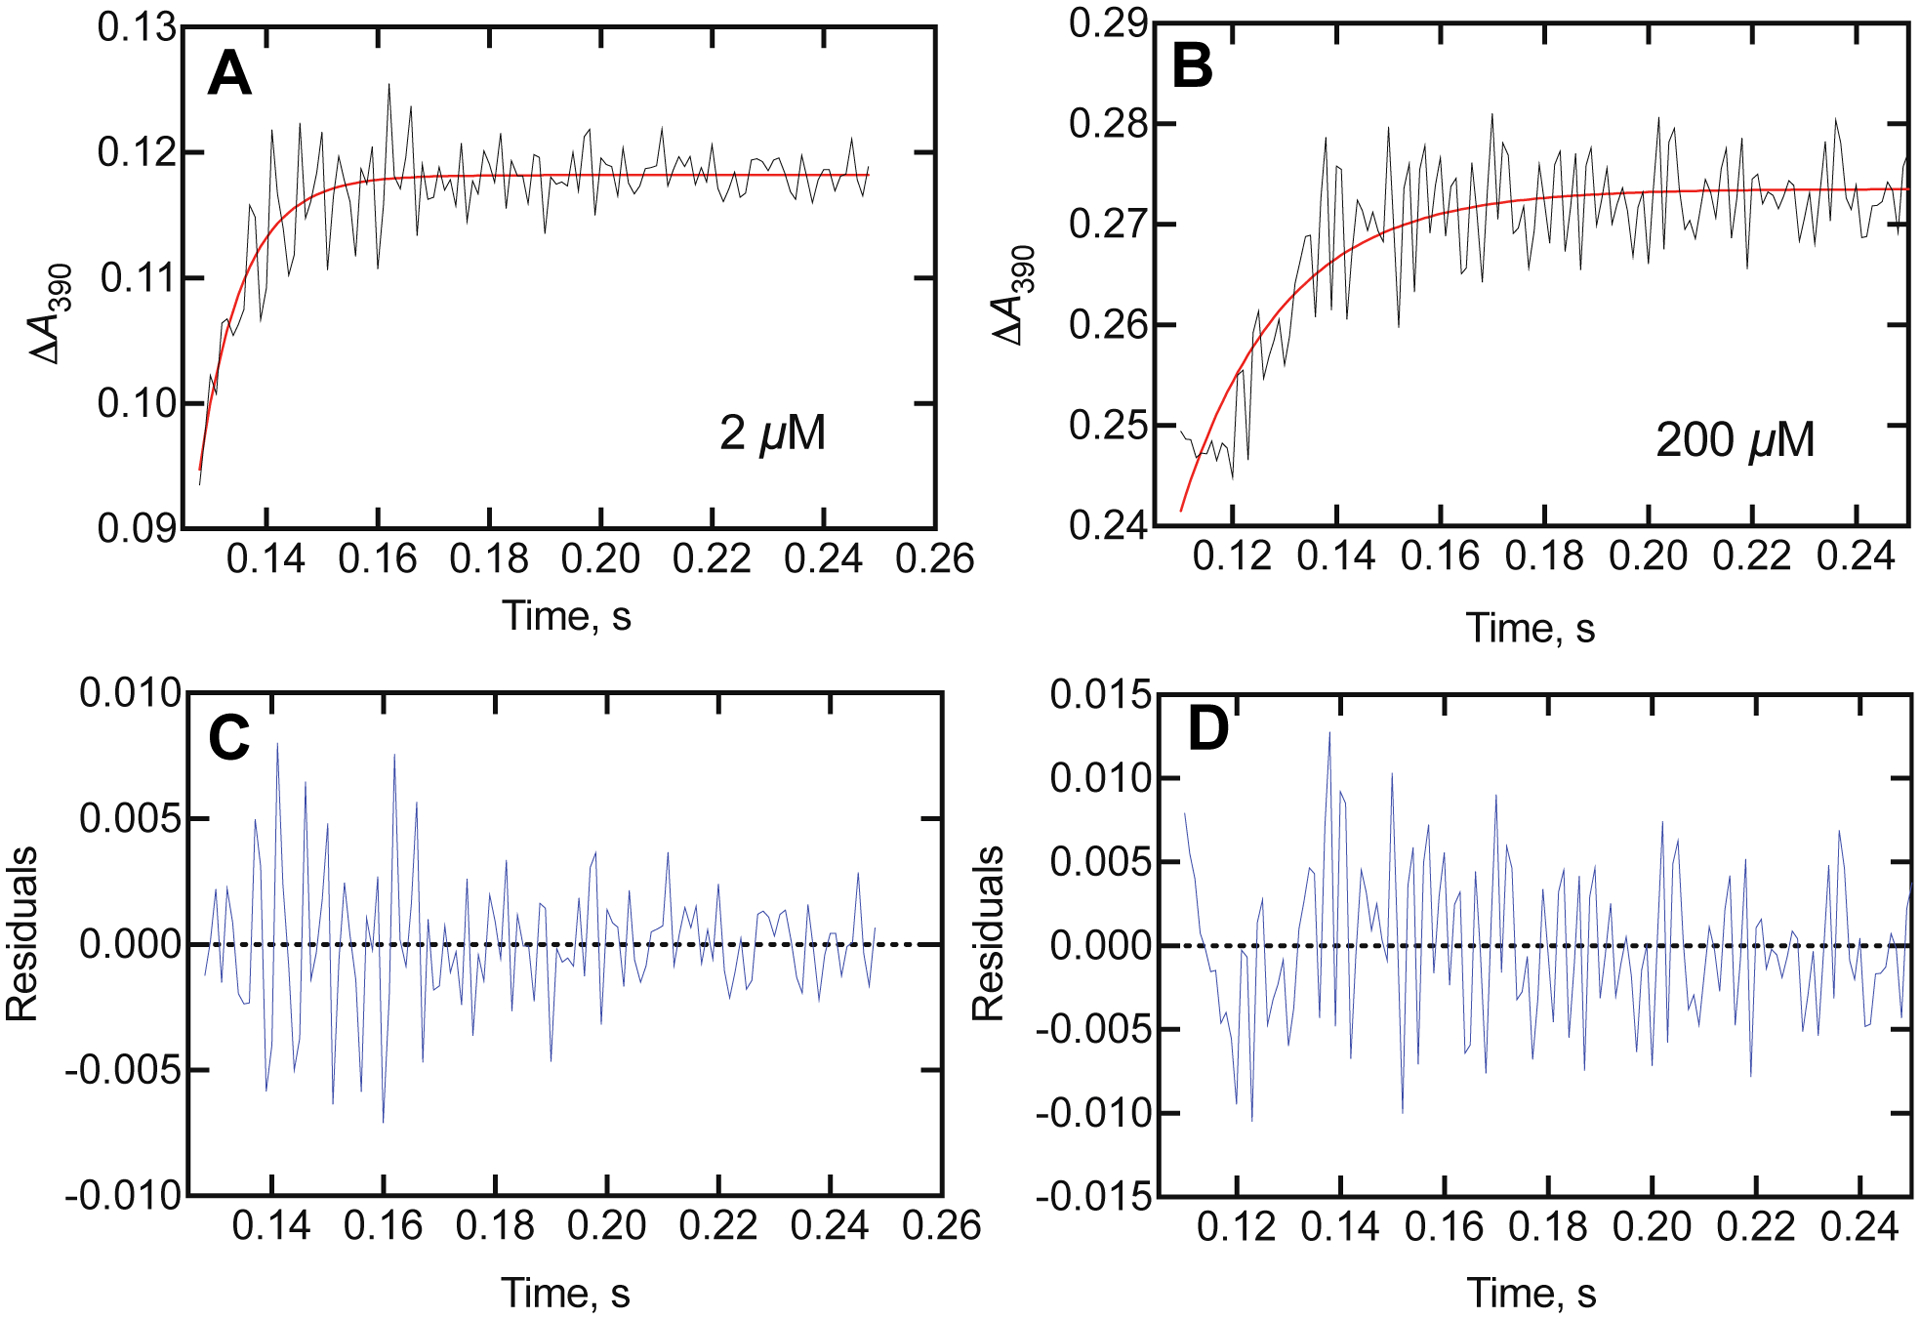
Kinetics of binding of dodecyl sulfate to P450BM-3. Traces of ΔA390 obtained upon mixing 2 μM P450BM-3 with dodecyl sulfate (all concentrations listed are final in the observation cell; the concentrations in the two mixing syringes are twice the final). A. Trace for 2 μM dodecyl sulfate (black), with fit (red) to a single exponential of 127 ± 4 s−1. B. Trace for 200 μM dodecyl sulfate (black), with fit (red) to a single exponential of 51 ± 4 s−1. C. Residuals plot for fit in part A. D. Residuals plot for fit in part B.