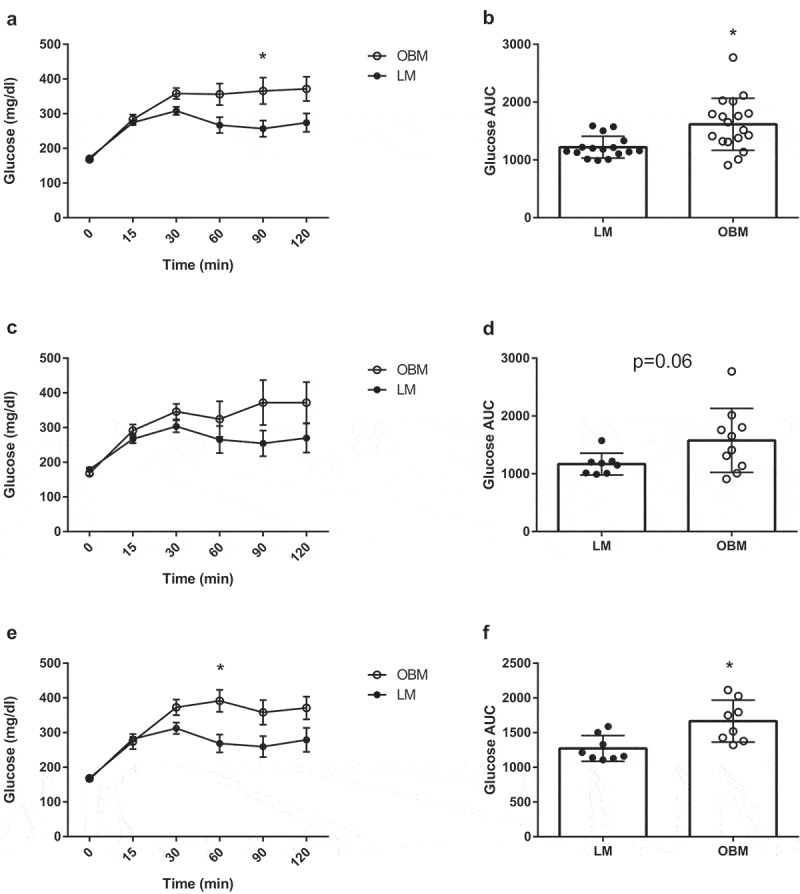
Figure 5.

Obese gut microbiota transplantation leads to impaired glucose tolerance in germ-free mice. A) Glucose tolerance test between LM and OBM in both cohorts combined, B) Area under the curve for glucose tolerance test in both cohorts combined, C) Glucose tolerance test between LM and OBM for cohort 1, D) Area under the curve for glucose tolerance test for cohort 1, E) Glucose tolerance test between LM and OBM for cohort 2, F) Area under the curve for glucose tolerance test for cohort 2. Data are expressed as mean ± SEM, n = 9–10/group for individual cohorts; n = 18–20 for both cohorts combined. Statistical analysis was performed using two-way ANOVA. *p < .05 between LM and OBM at indicated time point
