
Figure 2.
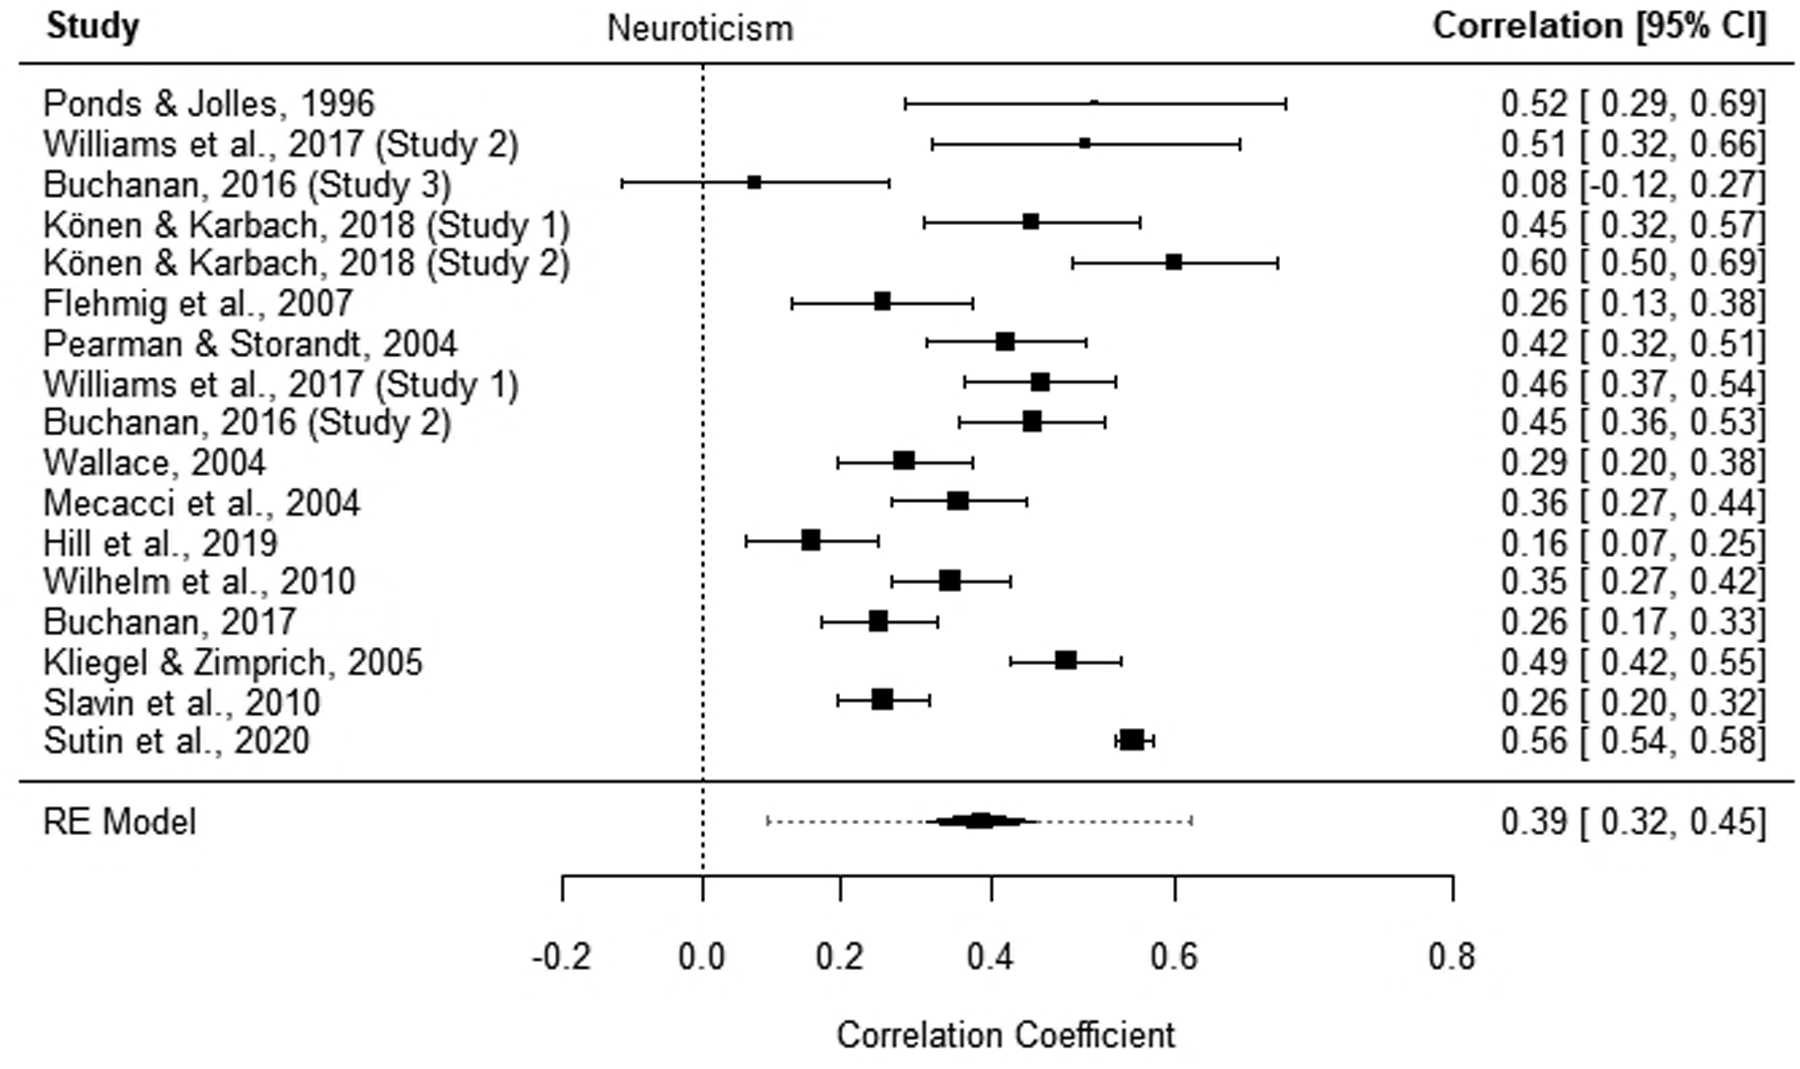
Forest plot for neuroticism. The plot summarizes the individual study estimates and the average effect of the random-effects (RE) model. Effect sizes are displayed in correlation coefficients with corresponding 95% confidence intervals (95% CI). The x-axis ranges from r = −.20 to r = .80. Studies are listed in order of their sample size (i.e., smallest to largest).