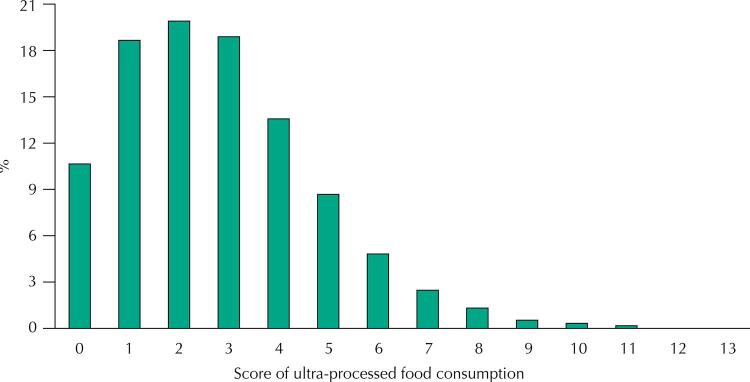
Figure. Distribution (%) of the population according to the ultra-processed food consumption scorea. Adult population (≥ 18 years old) of the capitals of the 27 federative units of Brazil, 2019 (n = 52,443).
a Number of ultra-processed food subgroups (n = 13) consumed on the day before the interview.

