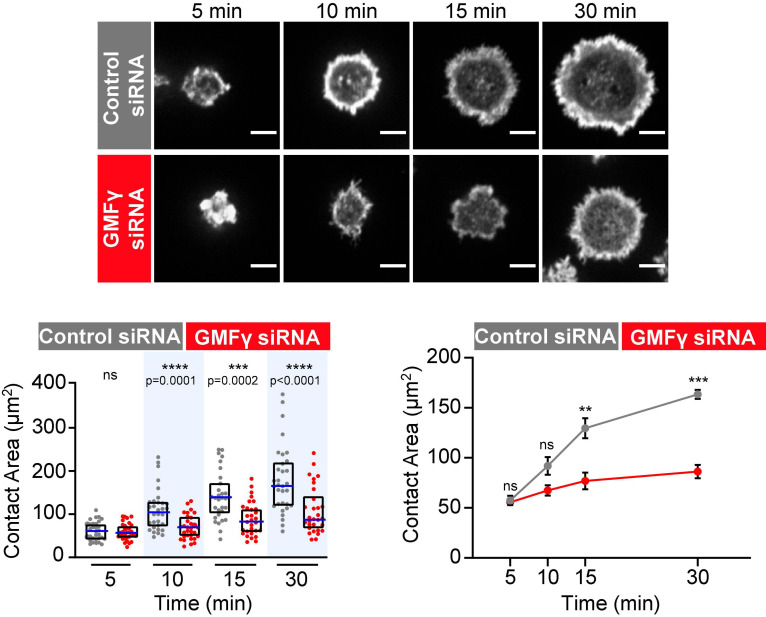
FIGURE 2.
Depleting GMFγ reduces B cell spreading on immobilized HEL. Raji D1.3 B cells that had been transfected with either control siRNA or GMFγ siRNA were added to coverslips coated with 0.22 μg/cm2 HEL and allowed to spread for the indicated times. Representative confocal microscopy images of cells stained with rhodamine-phalloidin are shown. Scale bars: 5 μm. The cell area was quantified using the actin staining to define the cell edge. In the dot plot (left graph), each dot represents one cell, the median (blue line) and interquartile ranges (black box) for > 30 cells are shown for each time point, and p-values were determined using the Mann-Whitney U-test. The line graph on the right shows the mean ± SEM of the median cell areas from three independent experiments. Where no error bars are shown, they were smaller than the symbols. p-values were determined using paired two-tailed t-tests. ****p < 0.0001; ***p < 0.001; **p < 0.01; ns, not significant (p > 0.05).

