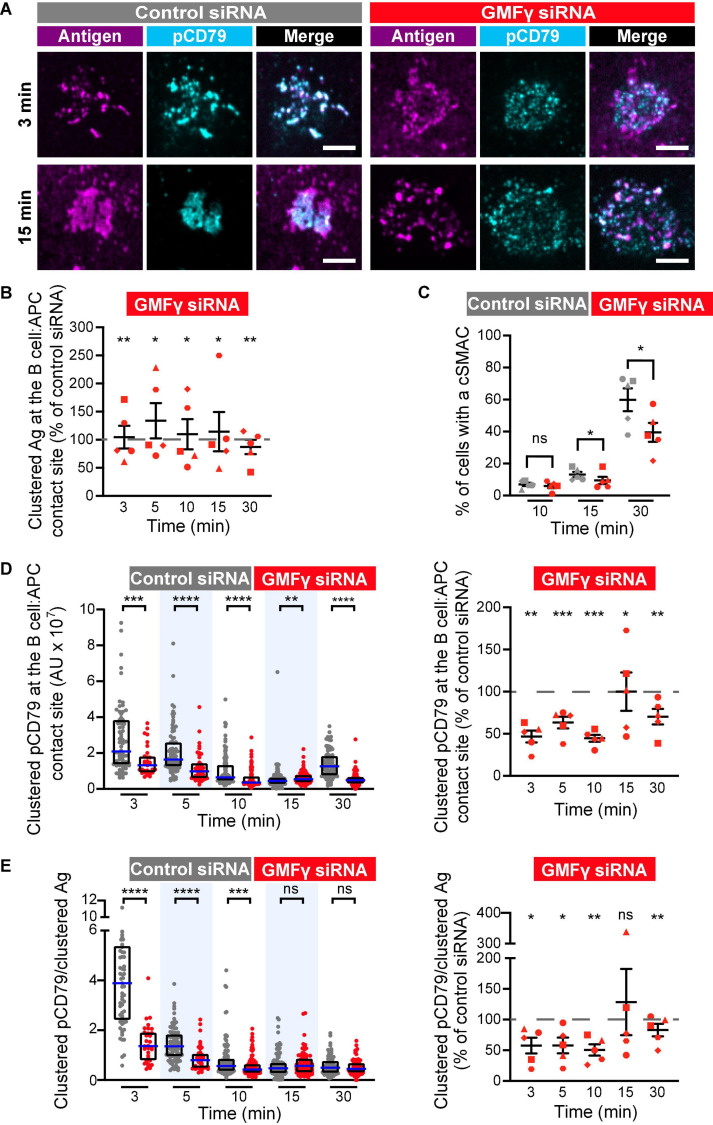
FIGURE 5.
Depleting GMFγ reduces cSMAC formation and proximal BCR signaling at the immune synapse. Raji D1.3 B cells were transfected with either control siRNA or GMFγ siRNA and added to COS-7 APCs expressing the mHEL-HaloTag Ag (magenta). The cells were fixed at the indicated times and stained with an antibody that recognizes the phosphorylated CD79 ITAMs (pCD79, cyan). The B cell-APC interface was imaged by spinning disk microscopy. (A) Representative images from one of five independent experiments. Scale bars: 5 μm. (B) The total fluorescence intensity of the mHEL-HaloTag Ag that had been gathered into clusters at the B cell-APC contact site was quantified for each B cell and the median values were calculated for each time point. Each symbol on the graph represents the median value for the GMFγ knockdown cells, expressed as a percent of the median value for the control siRNA-transfected cells for the same time point in the same experiment. The differently shaped symbols represent five independent experiments. Paired t-tests were used to calculate p-values. (C) The percent of cells that had formed a cSMAC, defined as > 90% of the total Ag fluorescence intensity being contained in one or two clusters, is graphed. The different symbols represent independent experiments. Paired t-tests were used to calculate p-values. (D) The total fluorescence intensity of pCD79 that was present in clusters at the B cell-APC contact site was quantified for each B cell. The left panel shows representative data from one experiment. Each dot is one cell. n > 31 cells per condition. The median (blue line) and interquartile ranges (black box) are shown. The Mann-Whitney U-test was used to calculate p-values. The right panel shows the results from five independent experiments, presented as in (B), with n > 30 cells per condition in each experiment. Each symbol represents a single experiment in which the median pCD79 fluorescence intensity for GMFγ-depleted cells is expressed as a percent of the corresponding median value for the control cells. Paired t-tests were used to calculate p-values. (E) For each B cell represented in (D), the total fluorescence intensity of clustered pCD79 was divided by the total fluorescence intensity of the clustered mHEL-HaloTag Ag. The median (blue line) and interquartile ranges (black box) are shown. The data are presented as in (B,D). ****p < 0.0001; ***p < 0.001; **p < 0.01; *p ≤ 0.05; ns, not significant (p > 0.05).

