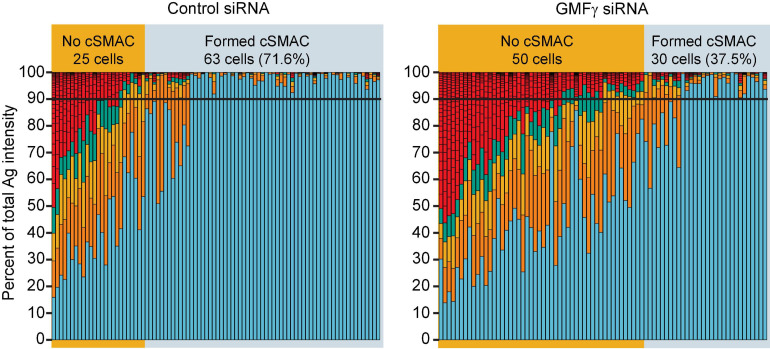
FIGURE 6.
Depleting GMFγ reduces the percent of cells that form a cSMAC. Raji D1.3 B cells that had been transfected with control siRNA or GMFγ siRNA were added to mHEL-HaloTag-expressing COS-7 APCs. The cells were fixed after 30 min and the B cell-APC interface was imaged by spinning disk microscopy. The stacked bar plots show the fraction of the total Ag fluorescence intensity in individual clusters. Each bar represents one cell and each colored segment within a bar represents a single Ag cluster. The size of the colored segment is proportional to the fraction of the cell’s total Ag fluorescence intensity that is contained within that cluster. Cells in which > 90% of the total Ag fluorescence intensity (black horizontal lines) was contained in 1–2 clusters were deemed to have formed a cSMAC. The data are from one of the 5 independent experiments that are compiled in Figure 5C.

