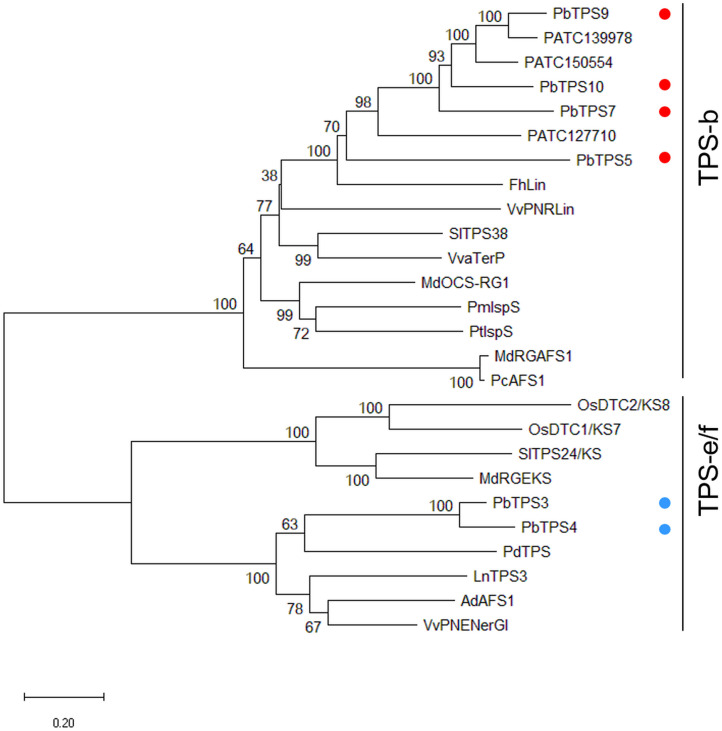
FIGURE 1.
Phylogenetic analysis of PbTPS3, PbTPS4, PbTPS5, PbTPS7, PbTPS9, PbTPS10, and other plant TPSs. The coding sequence was used to construct a phylogenetic tree using the nearest neighbor-joining method with the Jones–Taylor–Thornton model and pairwise deletion with 1,000 bootstrap replicates by MEGA 7.0. The numbers at each node represent the bootstrap values. The MTPS of Phalaenopsis orchid are marked with red dots. PbTPS5, PbTPS7, PbTPS9, and PbTPS10 are grouped in the TPS-b subfamily and labeled in red dots. PbTPS3 and PbTPS4 are grouped in the TPS-e/f subfamily and labeled in blue dots. Information on TPS genes used for phylogenetic analysis is in Supplementary Table 1.

