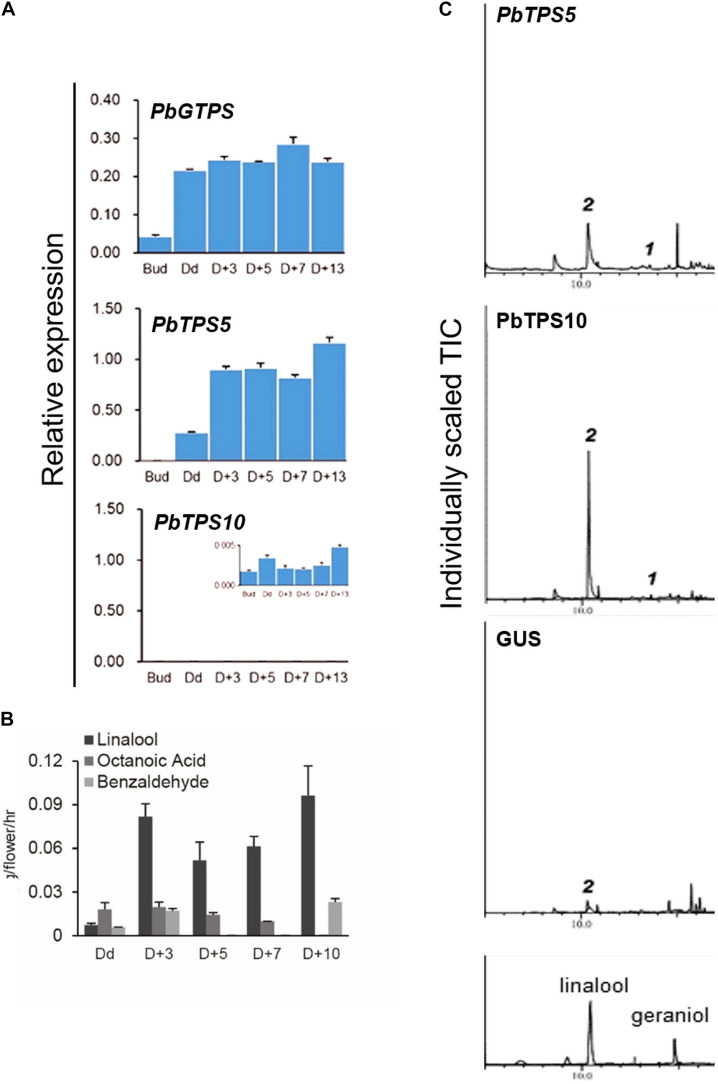
FIGURE 4.
(A) qRT-PCR analysis of gene expression of PbGDPS, PbTPS5, and PbTPS10 in flowers. The inset for PbTPS10 is the enlargement of the original scale. (B) Floral volatile organic compounds (VOCs) emitted from P. I-Hsin Venus. (C) Functional characterization of PbTPS5 and PbTPS10 transiently overexpressed in Venus. Plants overexpressing GUS were a negative control.

