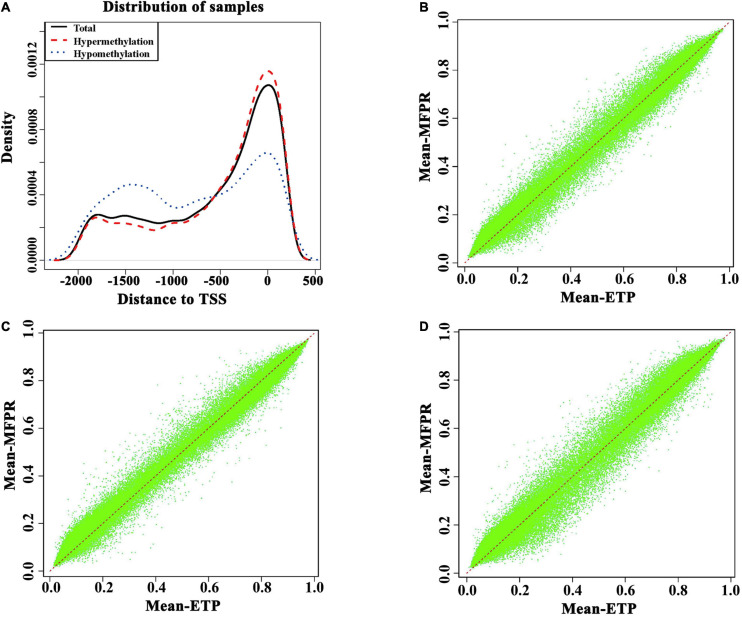
FIGURE 3.
Differential methylation near transcription start sites (TSS) and promoters. (A) Density plots of the DMRs in TSS –2,000 to 500. Hypermethylation (red curve) represents the density curve where the mean beta is greater in the MFPR group than in the ETP controls. Hypomethylation (blue curve) represents the density curve where the mean beta is lower in the MFPR group than in the ETP controls, and total (black curve) represents the density curve at all loci. (B) Annotation of the promoter methylation density between the ETP vs. MFPR groups. (C) Annotation of the promoter methylation density between the ETP female vs. MFPR female groups. (D) Annotation of the promoter methylation density between the ETP male vs. MFPR male groups.

