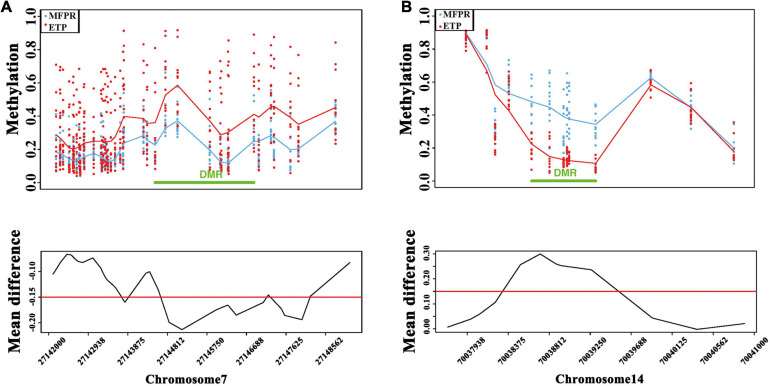
FIGURE 4.
DMR bumphunter analysis. (A) Scatter plots of DMRs and the mean difference (cutoff value = 0.15) between ETP controls (red) vs. the MFPR group (blue) at chr7: 27142000–27148562. (B) Scatter plots of DMRs and the mean difference (cutoff value = 0.15) between ETP controls (red) vs. the MFPR group (blue) at chr14: 70037938–70041000.

