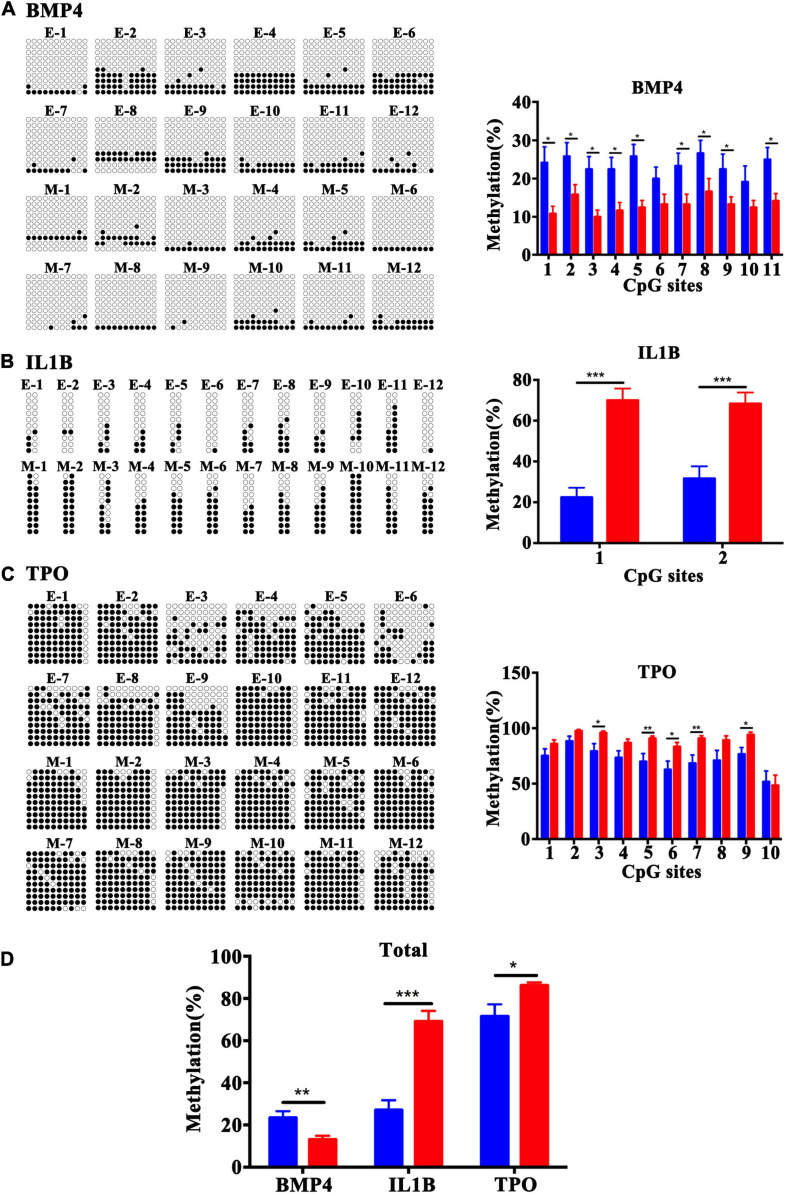
FIGURE 7.
Validation of the methylation levels by bisulfite sequencing in BMP4, IL1B, and TPO DMRs at base-pair resolution. Open circles and filled circles represent unmethylated and methylated CpG sites, respectively. (A) Bisulfite sequencing data for 11 CpG sites at the gene bodies of BMP4. (B) Bisulfite sequencing data for 2 CpG sites in the TSS1500 to TSS200 regions of IL1B. (C) Bisulfite sequencing data for 10 CpG sites at the 1st exon and 5′UTR of TPO. (D) Total methylation rate of BMP4, IL1B and TPO. The blue square represents the ETP group and red represents the MFPR group. Data are presented as mean ± SEM. *p < 0.05; **p < 0.01; ***p < 0.001.

