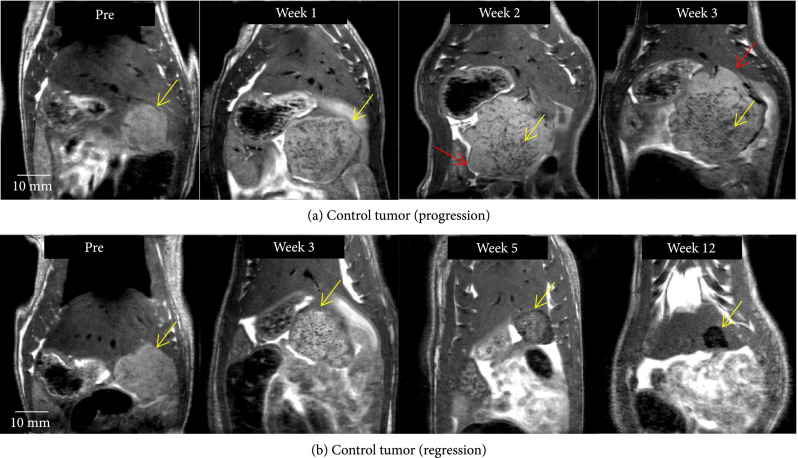
Figure 3.
Control tumor evolution on MRI. (a) Control tumor (yellow arrow) demonstrates satellite nodules along the periphery of the primary tumor (red arrow), which eventually contribute to tumor progression. (b) Control tumor (yellow arrow) develops a mottled and heterogeneous appearance, similar to that of pseudoprogression by week 3 and regresses as evidenced by decreasing tumor burden at weeks 5 and 12.

